
A revenue-focused B2B marketing strategy ties your marketing budget to business outcomes. B2B marketing metrics help you see that connection, highlighting the activities that work, the results they produce, and the places where putting more money in could pay off most.
You can collect tons of marketing data and still fail to see whether it helps bring in revenue. Page views and social media likes may look encouraging, yet they reveal little about pipeline performance.
Check whether your metrics show a clear link between marketing activity and revenue outcomes; don’t focus only on the total number your team tracks.
B2B Marketing Metrics for Lead Qualification
Lead qualification metrics tell you how many leads advance at each stage, helping you direct budget, focus sales outreach, and forecast later pipeline conversion.
When you separate lead types, measurement moves beyond surface activity and closer to revenue outcomes, which makes prioritization sharper.
Marketing can nurture an MQL because it shows sufficient interest and fit, even though sales has not assessed it yet. Once sales reviews and agrees to pursue that MQL, it becomes an SAL. The lead becomes an SQL only after sales has formally verified its budget, authority, need, and timeline using BANT.
Marketing Qualified Leads
For a target profile, product interest and fit come together in an MQL. Content downloads, webinar attendance, and email engagement beyond a casual click can show that interest. These leads sit between raw contacts and buyers, with more promise but no purchase decision yet.
MQLs have interacted with marketing content and may be ready for sales contact. Write down the behavior and fit signals that qualify someone as an MQL, instead of leaving the definition to inconsistent hunches.
A useful MQL definition goes beyond a broad engagement cutoff. Add company size, job title, and interaction with key resources so sales receives better opportunities, spends less time sorting them, and keeps its focus.
Behavioral scoring looks at demo views, pricing-page visits, and other high-intent content actions to gauge purchase readiness.
Fit scoring judges account quality separately from behavior by using firmographics. Apply ICP traits such as company size, industry, and role.
MQL volume helps you manage the engine, but alone it offers weak evidence of actual impact.
Content interaction doesn’t always mean someone wants to buy. People may engage with it because they are:
- Looking for statistics
- Doing preliminary research
- Trying to contact a company about something irrelevant to sales
A single ebook download or ad click doesn’t justify sending repeated emails or making repeated phone calls.
Sales Accepted Leads
What turns an MQL into an SAL is clearing the agreed handoff bar, usually through a score threshold or a direct request from sales.
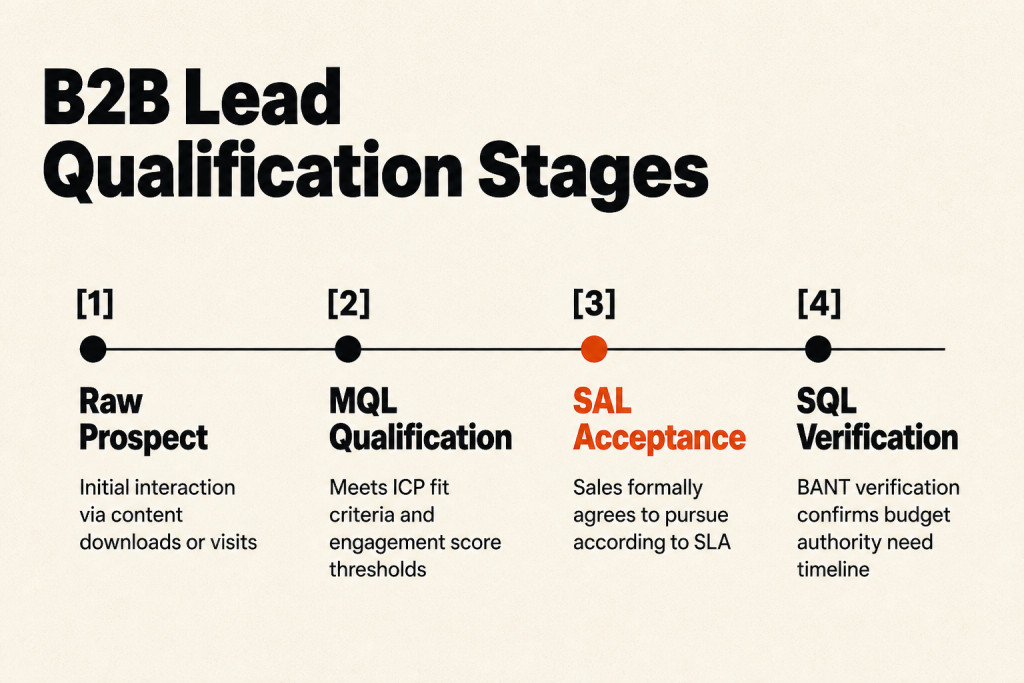
Sales must formally agree to pursue the lead before you call it an SAL. That decision distinguishes a lead passed over by marketing from one sales has agreed to work.
SLAs should spell out expectations for follow-up and status updates. Marketing and sales also need common definitions, targets, and handoff steps.
Sales Qualified Leads
Picture the moment an MQL moves far enough to warrant direct sales contact: it becomes an SQL. It must meet the criteria both teams agreed on and show buying intent, such as requesting a demo or displaying other purchasing signals.
The MQL-to-SQL handoff matters because shared rules limit time spent on unlikely leads and build confidence between marketing and sales.
An SQL is sales-ready only when BANT, or an equivalent framework, confirms budget, authority, need, and timeline.
SQLs represent legitimate opportunities, although their definition can stay subjective, just as it can for MQLs.
6QAs, or 6sense Qualified Accounts, is a metric developed by 6sense that uses empirical evidence to show when an account is nearing a purchase decision. It draws on:
- Buyers’ activity
- The number of buying team members who are engaged at the target account
- Historical information about your past deals
Lead Conversion Rate
For example, the lead-to-customer conversion rate measures the portion of leads within all website visitors during a defined period.
Calculate it by dividing total leads by total website visitors, then multiplying that figure by 100.
A low rate suggests funnel inefficiency, so compare your messaging with buyer intent and use personalized campaigns to support nurturing.
The MQL-to-SQL conversion rate tells you how many MQLs reach SQL status and whether campaign audiences fit and are ready for sales contact.
Across B2B, rates from 13% to 27% are generally typical. Results above 25% are strong, while results below 10% suggest reviewing scoring rules and stage definitions.
SalesForce puts a healthy MQL-to-SQL range at 30 to 50 percent for many B2B firms.
A weaker rate may reflect mismatched criteria, poor nurturing programs, or follow-up that happens too slowly.
Raise the rate through regular marketing and sales feedback, tighter qualification rules, and quicker replies to promising leads.
Pipeline Progression Metrics
In the middle of measurement, pipeline metrics tie marketing activity to revenue.
Pipeline contribution rate measures the amount of active pipeline that marketing either originated or affected. Most importantly, use it as one of the clearest measures of marketing’s part in revenue generation.
Marketing’s role is contribution.
Pipeline Contribution
Pipeline contribution goes past cost per lead: it connects marketing activity to sales pipeline value being actively worked, rather than stopping at top-of-funnel efficiency.
B2B marketing teams generally target sourcing 30% to 50% of total pipeline, though the go-to-market model can change the appropriate target.
Marketing-sourced revenue covers only deals marketing originated. Marketing-influenced revenue includes any deal with at least one meaningful marketing touchpoint.

Under a broad attribution lens, every marketing touchpoint on a closed deal is counted. For B2B SaaS, a 30%+ share of closed-won marketing-influenced revenue is a defensible rule of thumb to the CFO.
Sales Cycle Duration
For marketing-sourced deals, Sales Cycle Duration shows whether generated leads close faster or slower than leads from other sources.
Sales Cycle Length tracks the days between MQL and close. A typical cycle attributed to marketing takes 60-180 days, while B2B sales cycles often stretch across three to twelve months.
Compare cycle time for deals with marketing engagement against those without it. This measure is underused, hard to game, and can be board-credible when cohorts are clean.
Customer Economics Metrics
Revenue KPIs include marketing-sourced revenue, marketing-influenced revenue, CAC, LTV:CAC, payback period, NRR (net revenue retention), and churn.
A useful B2B marketing scorecard links early signs to later results. MQL volume, engagement rate, and pipeline coverage come first, while CAC and customer retention rate show what those efforts produced.
Use the early signals to make weekly calls, then bring the later measures into quarterly reviews and annual budget discussions.
CPL tells you how efficiently you attract prospects, while CAC covers the entire path to a new customer. CLV sets the revenue limit for both, tying cost per lead, customer acquisition cost, and customer lifetime value together.
For B2B SaaS, CAC should stay at no more than one-third of CLV, expressed as a 1:3 relationship. That ratio supports sustainable acquisition economics, and CLV should be at least $15,000.
Customer Acquisition Cost
Customer Acquisition Cost captures the investment required to win one new customer through sales and marketing. To calculate it, divide the period’s combined sales and marketing spend by the number of customers acquired during that period.
CAC = Total Sales and Marketing Spend ÷ Number of New Customers Acquired
Count salaries, agency fees, software subscriptions, media spend, and every other direct acquisition cost in that calculation.
A quarterly sales-and-marketing outlay of $500,000 that produces 100 new customers results in a CAC of $15,000.
Using the formula on one example, £10k in spend divided across 50 customers gives a £200 CAC per customer.
Read CAC alongside CLV, because CAC alone cannot show whether acquisition economics are healthy. Treat these as lagging indicators used for quarterly strategy reviews and annual budget conversations, with CLV providing the revenue ceiling for evaluating both costs.
Customer Lifetime Value
Customer Lifetime Value (CLV) is the total revenue you expect one customer to generate during the relationship.
You can keep the basic CLV calculation to three inputs.
Average Revenue Per User x Gross Margin x Average Customer Lifespan
A long-term account worth £25,200 in CLV can justify larger upfront investments and more attention to retention.
Review customer value with LTV:CAC, Finance, and Customer success together. Compare what you invest with the lifetime value those customers produce.
“If our customers’ lifetime value starts falling against what we’re putting into a channel, that gives us a way to diagnose whether our messaging, audience targeting, or offering needs to change.”
Acquisition Cost Payback Period
A short payback period keeps immediate cash reserves safer, but chasing fast recovery too hard can steer the team away from larger, higher-value accounts that take longer to close.
CAC ÷ gross-margin-per-customer-per-month

The calculation, CAC ÷ gross-margin-per-customer-per-month, tells you how many months gross margin takes to repay acquisition costs. Under 12 months is strong.
Under 12 months is strong.
For high-LTV ICPs, a 12-18 month payback period is acceptable.
Anything over 18 months requires explanation.
Return on Marketing Investment
Marketing ROI shows the revenue returned for each dollar put into marketing. Teams commonly use it to support budgets and report results to executives.
Marketing ROI = ((Revenue Attributed to Marketing – Marketing Spend) ÷ Marketing Spend) × 100
When marketing ROI is positive, the program brought in more revenue than it cost. A negative result may point to weak performance or an attribution model that needs review.
A campaign that brought in £50k in sales on £10k of spend delivered an ROI of 400 percent.
Write down the attribution method, whether it’s W-shaped, full-path, or another agreed model, and apply it consistently across all reporting periods.
Changing that model halfway through the year breaks historical comparisons and makes ROI reporting weaker for finance and executive stakeholders.
ROI arrives after the fact, so it can’t set KPIs or help you fix an active campaign that’s falling short of its targets. It also leaves you unable to optimize a campaign that is currently missing targets.
If you measure ROI too soon, you may draw conclusions before the campaign has enough information and hurt the final result.
Recurring Revenue Stability
You can judge recurring revenue stability through Monthly Recurring Revenue (MRR), Average Deal Size, and Average Revenue Per User (ARPU).
- Monthly Recurring Revenue (MRR):
- Average Deal Size:, total revenue from closed deals. number of deals in the period. result used to identify deal-quality shifts and forecast growth. $10M new-revenue goal. $50K average deal size. 200 closed deals required.
- Assessing Average Revenue Per User (ARPU):
Monthly Recurring Revenue (MRR):
Add the subscription fees from every active customer each month to track predictable, contract-based income.
MRR gives you a baseline view of the health and scalability of SaaS and subscription-focused B2B models.
Average Deal Size:
Work out the average value of closed deals by dividing revenue from closed deals by the number of deals closed during the period.
That measure helps sales and marketing spot shifts in deal quality and forecast growth more accurately.
To reach $10M in new revenue with a $50K average contract value, the company needs 200 closed deals.
Assessing Average Revenue Per User (ARPU):
Calculate ARPU by dividing total revenue for the period by the total number of users.
ARPU helps you compare performance and find upsell or cross-sell opportunities.
Premium tiers, enhanced features, and service add-ons can all raise ARPU.
Even modest ARPU gains can turn into major business growth.
Fundamentals of B2B Marketing Measurement
Commercial analytics connect directly to growth and return on sales. McKinsey finds that B2B firms applying analytics well have 1.5 times the likelihood of achieving above-average growth, and can deliver return on sales up to five percentage points above peers.
E-commerce now generates 34% of B2B revenue, exceeding the share generated by in-person sales channels.
Every KPI is measured against an account universe and contact graph, with Discovery upstream of enrichment.
Metric Versus Key Performance Indicator Distinction
A KPI shows movement toward one defined objective; a metric is simply any data point you can measure. McKinsey’s gap is still plain: 61% of marketing leaders say their analytics don’t connect to organizational goals.
Dashboard bloat takes hold when teams collect dozens of figures but can’t tell whether marketing is growing pipeline or making revenue more efficient, or whether it can answer the pipeline-growth question.
Build a B2B marketing dashboard around three to seven true KPIs, then use supporting metrics to explain the numbers behind them.
Leading Indicators
Leading indicators give you an early read on future-quarter results and help you look ahead through MQL volume and website engagement, with pipeline coverage ratio providing another view.
For weekly optimization, use leading indicators as marketing’s signal and put these measures on shared dashboards:
- Pipeline coverage by quarter (target: 3-5x quota)
- Lead velocity (rate of new opportunity creation)
- Conversion rates at each funnel stage
- Win rates by lead source and campaign
Click through rate and cost per click show campaign performance in real time; conversion rate serves as a KPI as well.
Fresh data flows help track MQL velocity and time to first sales touch; they also cover response SLA metrics.
Lagging Indicators
Lagging indicators tell you what has already happened, including customer acquisition cost and marketing-sourced revenue, as well as customer lifetime value.
Customer acquisition cost and marketing-sourced revenue anchor the lagging view, alongside customer lifetime value. Revenue measures continue through closed deals, while CAC payback period and LTV:CAC act as board-level revenue metrics.
Strong teams use both: leading indicators guide agile decisions, while lagging indicators provide strategic validation.
One type alone leaves gaps that damage forecasting accuracy and budget planning.
Three Performance Measurement Tiers
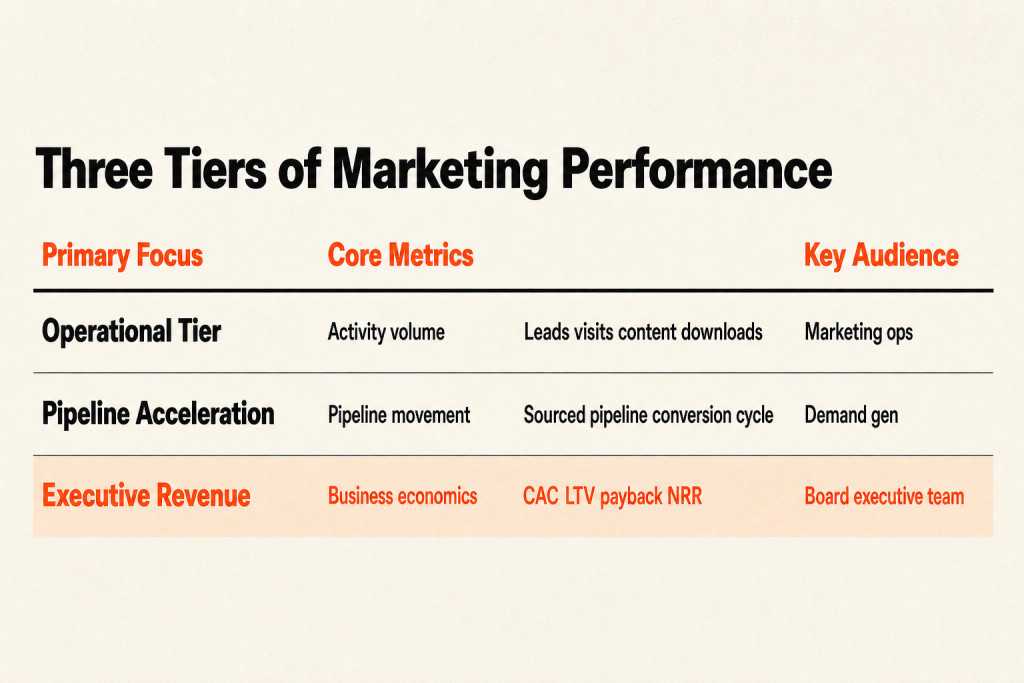
B2B marketing KPIs sit in three tiers: Operational Activity Tier records marketing’s actions, Pipeline Acceleration Tier tracks what it produced, and Executive Revenue Tier shows what it affected.
Lead volume, content produced, campaigns run, website sessions, downloads, and MQLs belong to the Operational Activity Tier.
These figures help manage the engine, but alone they offer weak proof of impact.
Marketing ops manages layer one.
Opportunities created, pipeline value, conversion rates by stage, and sales cycle length make up the Pipeline Acceleration Tier.
This middle tier links marketing activity to final revenue outcomes.
Demand gen runs against the second tier.
The Executive Revenue Tier covers marketing-sourced revenue, marketing-influenced revenue, CAC, LTV:CAC, and payback period.
The third tier gets most of the board’s attention.
Marketing’s role is contribution.
Attribution Modeling Methods
A typical B2B buying path includes six to ten or more touchpoints before a purchase decision is made.
Without a clear credit model for marketing touchpoints, every downstream metric, including CAC, ROI, and pipeline contribution, becomes unreliable.
Using one attribution model consistently matters more than choosing the right model.
For a simple entry point, use First-touch and last-touch models, then add multi-touch attribution as your analytics mature.

Use Multi-channel attribution to track every interaction across the customer journey, helping show which activities are truly driving revenue.
Pair attribution with a B2B digital marketing competitive analysis and assess campaign influence across the account’s buying journey to see which campaigns are pushing it toward revenue.
That wider view separates efforts that work from those that don’t, instead of crediting only the first or final touchpoint with most success.
Executive Reporting Standards
Use metrics to change team action; keep reviewing the data to catch trends and seize openings while working around challenges as they appear.
Review data-driven decisions with the team regularly.
- Review and refine your KPIs every week.
- Involve both marketing and sales teams in the analysis process.
- Use insight to guide long-term strategy and day-to-day execution.
Board-Defensible Performance Indicators
For the board, track revenue influenced by marketing, CAC, LTV:CAC, CAC payback period, and pipeline contribution, along with progress toward a specific business objective.
Misleading Standalone Activity Numbers
A high CPL can still make sense when the leads it brings in are very strong.
Email and advertising activity, including downloaded content, counts for little when it fails to create pipeline. Ads clicked alone also mean little when they do not create pipeline.

Balanced Scorecard Framework
The scorecard works only if leadership uses it actively.
Put the scorecard in circulation early, use it in planning meetings, connect it to resource requests, and revisit it throughout the year. Then it stays a working tool instead of becoming a slide deck assembled once each quarter.
Give every metric one clear objective, including progress toward a specific business objective; when each KPI points to growth, efficiency, expansion, or retention, its purpose becomes obvious.
Set benchmarks by segment and region; broad industry averages can mask real performance gaps across product lines and markets.
Review metrics on a steady schedule; checks at weekly-to-monthly intervals prevent quarter-end surprises and support faster decisions.
Organizational Alignment Framework
Once you’ve set benchmarks by segment and region, have Marketing and Sales review pipeline weekly, assess conversion rates and lead quality, then adjust targeting.
Revenue-Driven Target Modeling
Begin with revenue targets, then work backward; that math sets the direction for the entire measurement framework.
Shared Sales and Marketing Definitions
Review MQLs that were recently rejected together; this is the fastest route to resetting shared definitions.
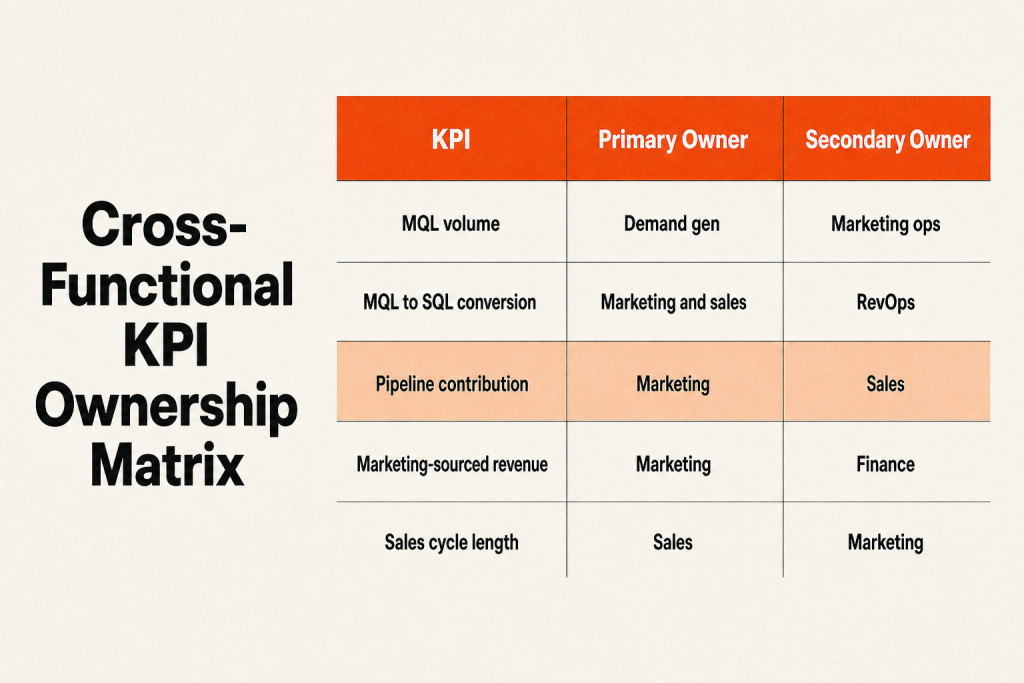
Cross-Functional KPI Ownership Matrix
Assign each KPI a primary owner and secondary owner within the ownership structure.
| KPI | Primary owner | Secondary |
|---|---|---|
| MQL volume | Demand gen | Marketing ops |
| MQL → SQL conversion | Marketing + sales (joint) | RevOps |
| Pipeline contribution | Marketing | Sales |
| Marketing-sourced revenue | Marketing | Finance |
| Sales cycle length | Sales | Marketing (contribution view) |
With those assignments in place, the matrix makes responsibility for lead volume, MQL volume, conversion, MQL → SQL conversion, Pipeline contribution, Marketing-sourced revenue, and Sales cycle length visible across teams.
Measurement Pitfalls
Choosing the right measures helps teams make better decisions, but misreading them can still push everyone in the wrong direction.
Vanity Metric Over-Reliance
Page views may look healthy while revealing almost nothing about an asset’s actual performance.
Keep notice-level indicators in tactical reviews; they belong in leadership discussions when they show no account has moved closer to buying.
Unactionable Analytics Silos
Dirty data makes analytics unreliable, and unreliable results quickly lose credibility.
When useful data sits across too many tools, tool sprawl blocks consistent revenue measurement.
Connect these data sources with the right tooling stack and create one reliable source of truth.
Reporting tools can still produce false signals when any of those foundations remain inconsistent. Misleading dashboards create another risk for decision-makers.
A unified platform gives you aggregated channel reporting and account-level drill-down for account-based marketing measurement and pipeline attribution.

Roughly 50% of decision-makers lack a LinkedIn presence; mobile direct-dial coverage reaches only 10-20%.
Changing contact databases each year won’t repair the underlying coverage architecture; all three rely on the same source graph. Cycling through multiple contact databases annually repeats the same coverage gap.
Misalignment With Business Goals
Marketing and sales need shared definitions, targets, and clear handoff processes.
When each team chases different numbers, internal competition replaces customer focus, while separate marketing and sales metrics lead to the same result.
Use an agreed MQL definition and align on pipeline contribution to clear friction from conflicting numbers in different systems.
Marketing gets a seat at revenue planning when it can name specific programs and show their measurable effect on pipeline and closed revenue.
That proof keeps marketing from being treated as a cost center.
At a 20% close rate, you need 1,000 qualified opportunities.
Frequently Asked Questions
What are the key B2B marketing metrics for driving revenue?
Three figures anchor revenue-driving B2B measurement: customer acquisition cost (CAC), pipeline contribution rate, and the rate at which MQLs become SQLs.
How do you measure marketing qualified leads and their impact on sales?
Hold weekly pipeline reviews to count marketing qualified leads, compare conversion rates, talk through lead quality, and adjust targeting with sales.
Which KPIs help understand customer acquisition cost and lifetime value in B2B marketing?
For one customer, Customer Lifetime Value, or CLV, is the total revenue a business expects across the entire relationship, making it the relevant KPI here.
How do B2B marketing KPIs differ from B2C metrics?
B2B KPIs rely on Account-level metrics, including ICP coverage and target-account engagement, with pipeline contribution completing the view.
B2C measurement stays at the individual level, tracking cost per acquisition and conversion rate while also considering repeat purchase; B2B sales cycles often run three to twelve months.
What constitutes a healthy MQL-to-SQL conversion rate?
For most B2B teams, a 25%+ MQL-to-SQL conversion rate remains a workable benchmark for evaluation.
How do you calculate customer acquisition cost payback period?
CAC payback period formula: (CAC ÷ gross-margin-per-customer-per-month).
The result is expressed in months. This figure tells you how many months of customer gross margin are needed to repay the acquisition cost.
Under 12 months signals a strong payback period.
For high-LTV ICPs, 12-18 months remains acceptable.
Any period over 18 months needs an explanation.
Why do marketing metrics fail to influence executive board decisions?
Layer three carries the most weight with the board; operational metrics still help you run the engine, but alone they provide weak proof of impact.
Credible B2B marketing metrics tie marketing activity to economics. Use activity metrics to diagnose what’s happening and pipeline metrics to steer decisions, while customer economics show whether growth holds up. That lets you separate lead volume from lead quality, follow the path from MQL-to-SQL conversion rate through pipeline contribution, and test CAC payback period against customer value. The board gets a connected scorecard, not a pile of isolated marketing numbers.