
Choosing a B2B vs B2C content marketing approach gets tricky when the buyer, approval path, and next step after conversion do not line up neatly. A plan can look sound on the calendar yet stumble over who has to approve it—or what counts as success afterward.
This guide helps you compare content investment benchmarks, production timelines, attribution models, and channel priorities, then use diagnostic steps to decide which tactics fit and when borrowing from the other playbook makes sense.
Key Differences in B2B vs B2C Content Marketing
The way people buy, who joins the decision, and what they’re buying shape how content gets built, funded, and judged. The company label only gets you so far; the purchase journey picks the playbook.
- Who makes the decision? Several approvers mean B2B proof, consensus-building content, and stakeholder-specific assets.
- What is the buyer protecting or pursuing? Business messaging fits performance and accountability; consumer messaging fits identity, convenience, and enjoyment.
- How long does the buyer need to decide? Longer evaluations need education and nurturing; shorter journeys need clear value and low-friction CTAs.
- What happens after the purchase? Implementation and service needs favor relationship-led content, while repeat retail purchases favor scalable retention and loyalty content.
- What does a conversion look like? A demo, consultation, or contract points to B2B measurement; add-to-cart and direct purchase point to B2C measurement.
Audience Intent
B2B content marketing
B2B content speaks to owners, executives, business buyers, and department heads. It explains product value, tackles business problems, and supports claims with empirical evidence. Thought leadership helps recognized brands move past “Initial Research” toward “Evaluation of Alternatives.” Authority can shorten the route.
Content serves a brand-building and thought-leadership role for 85% of B2B content creators. Once prospective customers know the business and trust its authority, they can move from “Recognition of a Need” straight to “Evaluation of Alternatives.”

B2C content marketing
B2C content reaches individual consumers with information, education, or entertainment. Its message usually leans on emotion, customer experience, retention, referrals, and loyalty programs.
B2C buyers usually want to feel safe, secure, and informed.
Messaging Architecture
Your audience decides the shape of the campaign, whether you’re speaking to B2B buyers or B2C buyers. Set the filters around professional decisions, emotional framing, evidence, CTAs, and brand balance. Keep the audience in charge.
- Emotional vs rational framing: B2B content leads with business impact, ROI, and efficiency gains, using emotion sparingly for relatability. B2C content leads with aspiration, identity, or a problem-emotion link, then uses rational data to support the claim.
- Depth of data: B2B content uses 3+ cited sources, explains its methodology, and includes comparative benchmarks. B2C content uses 1-2 stats for credibility and gives storytelling more room than evidence.
- CTA directness: B2B content uses soft CTAs such as “Download guide” and “Book consultation” before nurturing readers toward sales. B2C content uses “Shop now” and “Get 20% off” to reduce purchase friction.
- Brand vs demand balance: B2B content uses 70% demand-gen for problem-solution content and 30% brand content for thought leadership and culture. B2C content uses a 50/50 balance or a brand-heavy approach, weighing affinity and recall alongside conversion.
Use this content marketing for b2b approach when your content must support professional decisions.
| Filter | B2B Pass Criteria | B2C Pass Criteria |
|---|---|---|
| Emotional vs rational framing | Leads with business impact, ROI, efficiency gains; emotions used sparingly for relatability | Leads with aspiration, identity, or problem-emotion link; rational data supports emotional claim |
| Depth of data | 3+ cited sources; methodology explained; comparative benchmarks included | 1-2 stats for credibility; focus on storytelling over evidence |
| CTA directness | Soft CTAs (“Download guide”, “Book consultation”); nurtures toward sales conversation | Direct CTAs (“Shop now”, “Get 20% off”); minimizes friction to purchase |
| Brand vs demand balance | 70% demand-gen (problem-solution), 30% brand (thought leadership, culture) | 50/50 or brand-heavy; building affinity and recall as important as conversion |
The purchase sets the messaging direction. Business communication leans on value, service, and trust, while consumer messaging leans on price and the emotional payoff of getting the product. Consumer content reflects who buyers hope to become. Business content helps buyers show their teams that a choice is competent and safe. That burden is a little different.
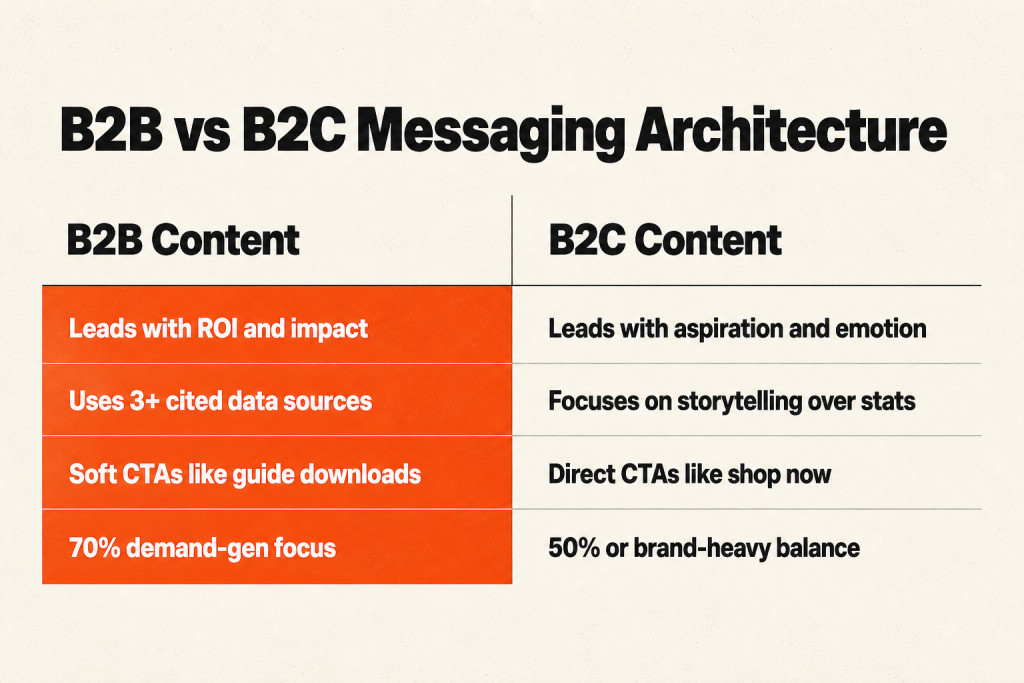
The audience changes the brief.
Sales Cycle Duration
B2B sales cycles are longer than B2C sales cycles, so B2B content nurtures buyers across multiple touchpoints while B2C content prompts conversion.
B2B sales cycles
B2B buyers often move through several touchpoints across a 6-18 months sales cycle. Gartner finds that 74% of B2B buyers independently conduct their research before reaching sales, and they consume an average of 13 pieces of content along the way.
Give CFOs ROI calculators, IT teams security whitepapers, and end-users onboarding guides. Each role needs its own evidence during the buying process.
B2C sales cycles
An impulse B2C purchase may happen within minutes, while a considered purchase such as furniture or electronics can require a b2c content marketing strategy built for a 1-3 month decision. Direct calls to action push conversion, and flash sales, limited-time offers, and influencer partnerships add urgency.
B2B content has to serve a buying group, not just one person. Forrester’s 2026 research says that 16 stakeholders are now involved in a B2B purchase decision, up from 5 in previous years. Of those groups, 74% experience unhealthy internal conflict during the decision process. Comparative guides for weighing options, tools for calculating returns together, and checklists for implementation help people reach consensus. Content designed for the group increases purchase confidence by 20% relative to content focused on persuading individuals.
Buying groups need materials they can share.
Relationship Building
Because B2B transactions tend to be worth more, those companies have more room than B2C brands to invest in winning individual customers. A particularly high average order value can support tailored content for named prospects. The economics set the pace.
Tailor content for named prospects when AOV supports it. Scalable content still carries the wider load.
B2C companies build relationships as well, but they usually put less effort into custom content or courting one potential customer at a time. They favor scalable, engaging material with a clear brand personality and familiar consumer pain points, while loyalty programs support repeat purchases. Personalization can show up, but it usually targets audience segments instead of individual leads.
Distribution Networks
Channel access and channel priority shift with the business model, and the difference is practical. B2C reaches across wider nets; B2B selects more carefully.

- B2C reach: B2C companies have virtually unlimited opportunities through social networks, popular websites, traditional advertising, and geo-targeting apps that serve content and promotions when a prospect nears a shop.
- B2B reach: B2B businesses sometimes have a more limited scope of potential engagement opportunities.
- Channel selection: Choose highly targeted, relevant channels for content promotion, including Organic search (SEO/GEO), Paid social, Email nurture, and Webinars / events.
- Platform use: B2B content teams use LinkedIn and email, while B2C marketers distribute content on Instagram / TikTok.
| Channel | B2B Priority | B2C Priority |
|---|---|---|
| Organic search (SEO/GEO) | Primary, drives 40-60% of qualified traffic; optimizes for entity salience, schema.org, and AI citation | Secondary, drives 15-25% of traffic; focuses on product and category pages |
| Primary, thought leadership, employee advocacy, ABM targeting; 3-5 posts per week | Low, limited consumer reach; used only for employer branding | |
| Instagram / TikTok | Emerging, B2B brands testing short-form video for brand awareness | Primary, drives 50-70% of social traffic; daily posting required |
| Paid social | Moderate, supports ABM campaigns; 20-30% of budget | Primary, feeds algorithm; 50-70% of budget |
| Email nurture | Primary, delivers gated content, event invites, case studies; 6-12 touch sequences | Moderate, transactional and promotional; 2-4 touch sequences |
| Webinars / events | Primary, generates 30-40% of SQLs; live + on-demand | Low, limited use outside product launches |
B2C distribution reaches more consumer-facing opportunities. B2B depends on focused channels decision-makers already consult, including LinkedIn, email, and focused events. The buyer decides the channel list.
Content Production Dynamics
Investment Requirements
In b2b vs b2c content marketing, match production effort to speed, volume, and platform testing needs; the buying system sets the workload, so investment follows the work.
Speed and volume
B2C puts speed and volume first, keeping platform algorithms supplied with fresh content. Keep the feed moving.
Iteration cycles
B2C teams move through iteration cycles 3x faster and need 5x more creative variants to test platform performance. Testing sets the pace.
| Dimension | B2B | B2C |
|---|---|---|
| Median content cost | $3,500, $8,000 per whitepaper; $1,200, $2,500 per blog post | $400, $900 per blog post; $200, $500 per social campaign |
| Production time | 40 hours per whitepaper; 12 hours per 2,500-word article | 8 hours per 800-word post; 4 hours per social campaign |
| Content lifespan | 18-36 months (evergreen assets with regular updates) | 3-6 months (trend-driven, algorithm-dependent) |
| Team size | 1 strategist per 3 writers; SME access required | 1 creative director per 5 creators; design/video heavy |
| Refresh frequency | Quarterly for pillar content; annually for case studies | Weekly for social; monthly for blogs |
| Distribution channels | LinkedIn, email nurtures, organic search, partner co-marketing | Instagram, TikTok, paid social, influencer partnerships |
| Conversion definition | Marketing Qualified Lead (MQL); demo request; content download | Add-to-cart; email signup; direct purchase |
| Attribution window | 90-180 days (multi-touch required) | 7-30 days (last-touch often sufficient) |

The comparison of b2b and b2c content marketing looks at content cost, production time, lifespan, team structure, refresh frequency, distribution channels, conversion definitions, and attribution windows. Together, those variables shape the operating model.
Content Tone
B2B tone
For B2B, authority and evidence lead the tone: 2,500-word articles cite industry research and tackle specific business challenges. Proof carries the piece.
The setting is professional, with readers weighing solutions during work hours and passing content to colleagues as they build consensus.
B2C tone
B2C leans on relatability and entertainment: 800-word posts use conversational language and connect with personal identity or lifestyle. The tone stays close to the reader.
Here, people decide as individuals, reading during leisure time and looking for inspiration or validation. Personal choice moves faster.
AI-generated content saturation
Both models are dealing with AI-generated content saturation in 2026. Right now, 95% of B2B marketers use AI tools, while 43% struggle to tell similar outputs apart.
Brand voice guidelines can mark the territory AI can’t copy through proprietary data interpretation and industry-specific humor. Alongside those elements, contrarian takes grounded in experience set voices apart.
In practice, let the buyer situation shape the voice within each format: a B2B article being shared with colleagues should keep its evidence and business challenge in the foreground, while a B2C post aimed at someone browsing for inspiration can sound more conversational and personal. With AI-generated content making similar outputs harder to distinguish, these tone choices need to be paired with the brand’s proprietary interpretation, industry-specific humor, or experience-based contrarian take—not just polished wording.
How Sales Cycle and Deal Size Shape Content Volume
More content may lift visibility and create more touchpoints, but weak work can wear down trust and fail to convert. The right balance follows sales cycle length and deal size, while competitive differentiation also shapes the choice.
| Sales Cycle | Avg Deal Size | Content Volume (pieces/month) | Quality Tier Priority |
|---|---|---|---|
| Under 7 days (B2C impulse) | Under $100 | 20-40 | Tier 3: Curated insights, trending commentary, user-generated content |
| 7-30 days (B2C considered) | $100, $500 | 12-20 | Tier 2: Expert interviews, comparison guides, how-to content |
| 30-90 days (SMB B2B) | $500, $5,000 | 8-12 | Tier 2 + some Tier 1: Case studies, product comparisons, implementation guides |
| 90-180 days (Mid-market B2B) | $5,000, $50,000 | 4-8 | Tier 1 majority: Original research, detailed case studies, ROI frameworks |
| Over 180 days (Enterprise B2B) | $50,000+ | 2-4 | Tier 1 only: Industry benchmarking reports, whitepapers, executive briefings |
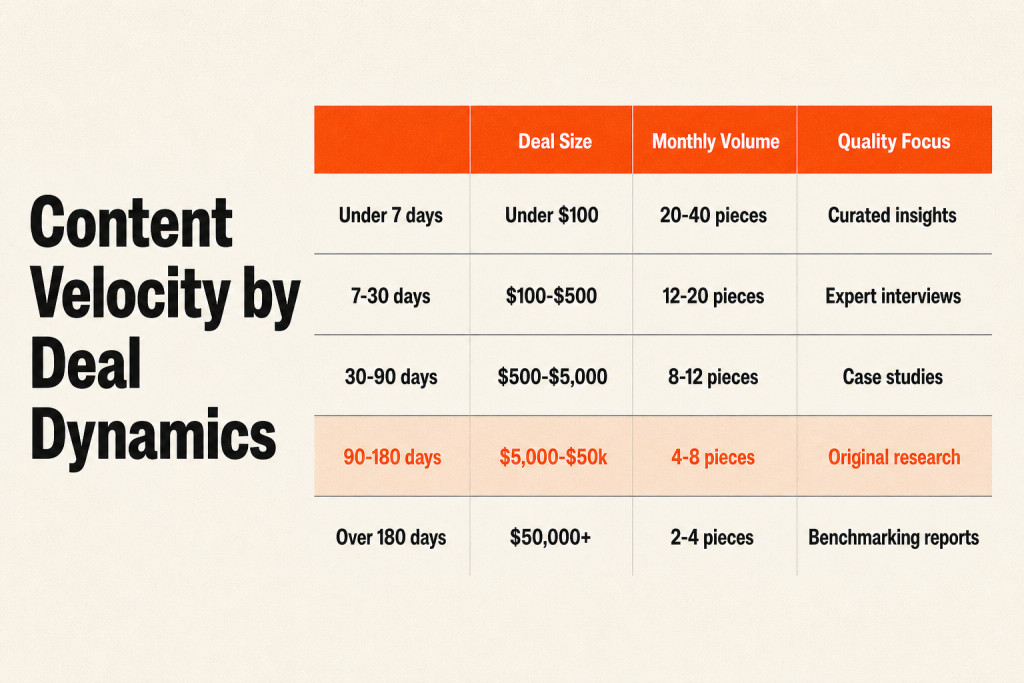
The table’s quality tiers reflect different production demands.
- Tier 1 (Original research): Proprietary data, commissioned studies, named methodology, and a peer-reviewed approach require 40+ hours, subject matter expert involvement, and legal review.
- Tier 2 (Expert interviews): Named sources, direct quotes, and multiple perspectives require 12-20 hours, practitioner access, and original analysis.
- Tier 3 (Curated insights): Existing sources, trend commentary, and reformatted public data require 4-8 hours, basic research skills, and fast turnaround.
One SaaS company had a $25,000 average deal size and a 120-day sales cycle. It published 40 blog posts monthly, all Tier 3, packed with generic tips and listicles but no original data. Traffic rose 5% over six months, while MQLs stayed flat.
The company brought output down to 6 pieces monthly and used only Tier 1 and Tier 2. MQL volume climbed 40% within four months.
Publishing daily keeps algorithmic social feeds warm and gives teams quick creative-angle tests. Without steady production bandwidth, that pace can cause rapid creative burnout, so enterprise teams may use a Content Marketing Agency to handle asset production.
Asset Alignment Diagnostics
This five-filter framework rates whether a content piece fits B2B, B2C, hybrid, or neither. It needs at least 3 filters to count as a strong fit.
- Emotional vs rational framing: B2B leads with business impact, ROI, and efficiency gains, using emotion sparingly for relatability. B2C leads with aspiration, identity, or a problem-emotion link, while rational data supports the emotional claim.
- Depth of data: B2B includes 3+ cited sources, explains methodology, and provides comparative benchmarks. B2C uses 1-2 stats for credibility and puts storytelling ahead of evidence.
- CTA directness: B2B uses soft CTAs such as “Download guide” and “Book consultation” to nurture a sales conversation. B2C uses “Shop now” and “Get 20% off” to reduce purchase friction.
- Visual vs text ratio: B2B is text-heavy, with charts and diagrams supporting dense information and white space protecting readability. B2C is visual-first, with images and video driving engagement while text supports the visuals.
- Brand vs demand balance: B2B uses 70% demand-gen for problem-solution content and 30% brand content for thought leadership and culture. B2C uses a 50/50 balance or a brand-heavy approach, where affinity and recall matter as much as conversion.

| Filter | B2B Pass Criteria | B2C Pass Criteria |
|---|---|---|
| Other filters | See the earlier comparison table | See the earlier comparison table |
| Visual vs text ratio | Text-heavy; charts/diagrams support dense information; white space for readability | Visual-first; images/video drive engagement; text supports visuals |
Purchase context tells you how to apply the filters. If leadership has to defend the purchase, center the piece on risk reduction and operational returns. If one person is making an individual discretionary decision, focus on instant emotional gratification and frictionless checkout.
Analytics and Attribution
Tie attribution to the sales cycle: B2B typically involves more touchpoints, while B2C moves faster and requires a different credit-assignment approach.
Build a basic measurement system first, then layer in advanced attribution.
- Record the first meaningful source. Use analytics or campaign tracking to see where the visitor first discovered the brand.
- Record the conversion event that matters. For B2B, that may be a qualified inquiry or demo request; for B2C, an add-to-cart or purchase.
- Connect the conversion to revenue where possible. Use a CRM or ecommerce platform to compare leads or orders by source, content type, and campaign instead of judging content by traffic alone. Start with native integrations such as HubSpot with Salesforce and Google Ads with GA4.
A long buying journey will hide some of the influence, but this trade-off gives your team a steady baseline for what to keep, improve, or stop.
Google Analytics defaults to “last-touch,” so content that first brings someone to a B2B website may get no sale credit.
Search Engine Optimization
For B2B:
B2B content should build entity salience with structured data, direct answers to specific questions, authoritative sources, and schema.org markup for AI language models.
For B2C:
B2C SEO uses broader terms to reach people ready to buy soon, so keep those terms broad. Anticipate follow-up queries by addressing the next questions readers may ask.

According to Statista, Internet search results help 66% of B2B buyers in the US discover products. The complete channel breakdown follows.
| Channel | Share of B2B Buyers in the US Who Use It To Discover Products |
|---|---|
| Internet search results | 66% |
| Online marketplaces | 50% |
| Product catalog | 43% |
| Industry associations | 42% |
| Online adverts | 35% |
| Referrals | 33% |
| Industry publications | 29% |
| Physical advertising | 24% |
| Trade shows | 23% |
| Social media advertising | 23% |
| TV advertising | 14% |
Internet search results lead, followed by Online marketplaces at 50%, Product catalog at 43%, Industry associations at 42%, Online adverts at 35%, Referrals at 33%, Industry publications at 29%, Physical advertising at 24%, Trade shows and Social media advertising at 23% each, and TV advertising at 14%.
People often take a short route from search to answer. Backlinko reports that 59% of Google users view only one page, while B2B blogs commonly publish 1,000+ words.
A first-page result averages almost 1,500 words, giving the piece enough space to cover the subject fully.
Artificial Intelligence Search Platforms
For 79% of B2B buyers, AI tools assist with research, so content needs a structure that supports this kind of discovery.
AI overviews tend to cite content with:
- FAQ sections with direct, quotable answers (40-60 words per answer)
- Transparent sourcing with clickable citations to primary research
- Comparison tables and structured lists that LLMs can extract
- Topic clustering where pillar pages link to deep-dive subtopic content
- Entity-rich writing that clearly identifies companies, products, methodologies, and outcomes
Keyword density on its own falls flat in AI search. After each section, answer the next question a buyer will probably ask, just as a sales conversation would. Follow-up questions count.
Advertising AI agents personalize campaigns by changing creative, copy, and targeting as performance signals shift. B2C marketers using them report 35% higher purchase frequency than those running campaigns manually.
Attribution Frameworks
Choose an attribution model based on the B2B or B2C journey, the sales cycle, and how many touchpoints sit between discovery and conversion.
| Model | B2B Fit | B2C Fit | Use When |
|---|---|---|---|
| First-touch | Poor, ignores 6+ subsequent touchpoints | Moderate, works for top-of-funnel brand awareness measurement | B2C brand campaigns; understanding initial discovery channels |
| Last-touch | Poor, overvalues bottom-funnel, ignores nurture content | Good, accurate for impulse purchases under 24 hours | B2C direct response; products under $100 with <24hr cycle |
| Linear multi-touch | Good, distributes credit across 7.2 average touchpoints | Moderate, useful for considered purchases (travel, electronics) | B2B sales cycles >90 days; B2C purchases >$500 with research phase |
| Time-decay multi-touch | Best, weights later touchpoints while crediting early nurture | Moderate, overcomplicates short cycles | B2B with defined nurture sequences; high-value B2C subscriptions |
| Custom algorithmic | Best, uses ML to weight touchpoints by actual conversion influence | Good, if data volume supports model training | Enterprises with 10,000+ monthly conversions and data science resources |
When a B2B sales cycle is exceeding 90 days, Linear multi-touch attribution suits a plan built around blog posts, webinars, case studies, and demos.
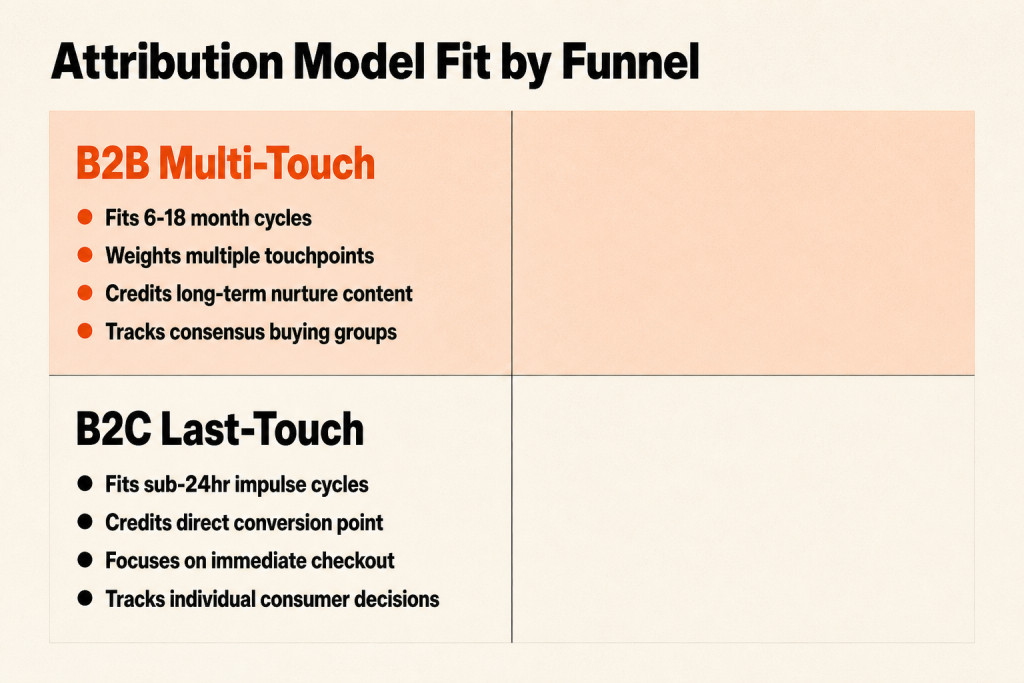
For a B2C impulse product under $100, last-touch works when people generally convert within 24 hours of discovery.
Hybrid models can fit B2B products with self-serve elements, such as Freemium SaaS, and high-consideration B2C purchases such as Automotive and real estate.
Performance Indicators
According to the Content Marketing Institute, Conversions are the most common measure for judging content performance. The table shows where B2B teams place their attention.
| Metric to Evaluate Content Performance | Share of B2B Marketers |
|---|---|
| Conversions | 73% |
| Email engagement | 71% |
| Website traffic | 71% |
| Website engagement | 69% |
| Social media analytics | 65% |
| Quality of leads | 52% |
| Search rankings | 45% |
| Quantity of leads | 41% |
| Email subscribers | 32% |
| Cost to acquire a lead, subscriber, and/or customer | 29% |
The measures cover Conversions, Email engagement, Website traffic, Website engagement, Social media analytics, Quality of leads, Search rankings, Quantity of leads, Email subscribers, and the costs of acquiring a lead, an email subscriber, or a customer.
For B2B, conversions mean Marketing Qualified Leads (MQL), demo request, and content download. For B2C, they usually mean Add-to-cart, email signup, and direct purchase.
Implisit reports a 13% average conversion rate from MQL to SQL, whereas webinar-sourced leads move from MQL to SQL at 17.8%.
Frequently Asked Questions
How Does Content Marketing in B2B vs B2C Differ?
These two systems ask for different kinds of persuasion. B2B content marketing builds durable relationships by pairing detailed, data-driven insights with thought leadership for decision-makers. B2C content marketing connects with a broader consumer audience through emotional connection, brand narratives, and rapid conversions. One leans rational and solution-oriented; the other sells emotion and brand experience.
What is the difference between B2B and B2C SEO strategies?
Because B2B SEO involves extended purchase timelines and several decision-makers, it relies on industry-specific keywords and authority building guided by user intent. B2C SEO reaches wider to build awareness, lift volume, and catch immediate purchase intent. For B2C, prioritize qualified traffic at scale while still capturing searches with immediate purchase intent.
What is the difference between B2B and B2C marketing channels?
B2B marketing uses workday channels such as trade publications and LinkedIn, while B2C marketing focuses on direct conversions among a wider consumer audience, supported by brand storytelling and consumer connection.
What are the best B2B marketing strategies for 2026?
In 2026, B2B marketing should prioritize personalized account-based marketing (ABM), AI-powered analytics, insightful educational content, and multi-channel campaigns using LinkedIn and email, including webinars. This mix gives the campaign a clear direction.
- Personalized account-based marketing (ABM): Target precise clients through personalized campaigns.
- AI-powered analytics: Use analytics for precise client targeting.
- Insightful, educational content: Produce content that establishes credibility.
- Multi-channel campaigns: Combine LinkedIn, email, and webinars for sustained engagement.
How do B2B and B2C business models differ?
Both models can work; the decision depends on the product, the target audience, the sales cycle, business goals, and the market. B2B usually means longer relationships and higher-value sales, while B2C runs on volume and faster transactions. The market decides the model.
What are the differences between B2B and B2C?
B2B, or business-to-business, means companies selling through commercial transactions with other companies, often involving relationship-building and extended sales cycles. B2C, or business-to-consumer, means selling straight to individual consumers, with high volume and brand experience. Different buyers, different setup.
Conclusion
The buying system determines the remaining choices. B2B content marketing calls for detailed proof and thought leadership, along with patience among the people involved in the purchase. B2C content marketing leans on brand storytelling to create audience feeling and encourage quick conversions. Match B2B SEO or B2C SEO to the buying path in b2b vs b2c content marketing, then pick channels, formats, campaigns, and measures that suit the model. Start by mapping the buying path, then choose the channels, formats, campaigns, and measures that fit it; let the B2B or B2C label come last.