
In today’s competitive SaaS landscape, the ability to measure content marketing performance is no longer optional—it’s essential for growth and strategic decision-making. However, only 46% of B2B marketers agree their organization measures content performance effectively.
In this article, we will together learn about how to measure SaaS content marketing and actionable tips to improve your strategy based on data. Let’s start!
Key takeaways:
|
1. Why Measuring SaaS Content Marketing Is Essential
Content is a vital business asset in the cutthroat SaaS market of today, not just a “good-to-have.” However, you must measure the performance of the content in order to treat it as an asset.
Measurement enables data-driven decisions, continuous optimization, and proof of ROI
When you consistently track and evaluate key content metrics, you gain the ability to:
- Quantify ROI: According to HubSpot’s 2024 State of Marketing report, 60% of marketers say proving ROI is their top challenge.
- Optimize performance: You can’t improve what you don’t measure. Data reveals what’s working and what’s not.
- Complement corporate objectives: Metrics make it easier to connect the success of content with sales, customer satisfaction, and product expansion.
- Maintain a safe budget: Success stories supported by data can support ongoing content investment.
“Tell me how I am measured and I’ll tell you how I will behave.”
— Featured in the SaaS Barometer Newsletter, highlighting how measurement shapes strategy, alignment, and performance across SaaS organizations
2. How To Measure SaaS Content Marketing? 16 Key Metrics
SaaS content marketing spans multiple goals: brand awareness, lead generation, product education, and revenue generation. Therefore, no single metric can define its success. A multi-metric framework is necessary instead.
Use a combination of cost, lead generation, engagement, and consumption metrics to gauge the success of your SaaS content marketing. The following 16 metrics are essential for any SaaS marketer to monitor:
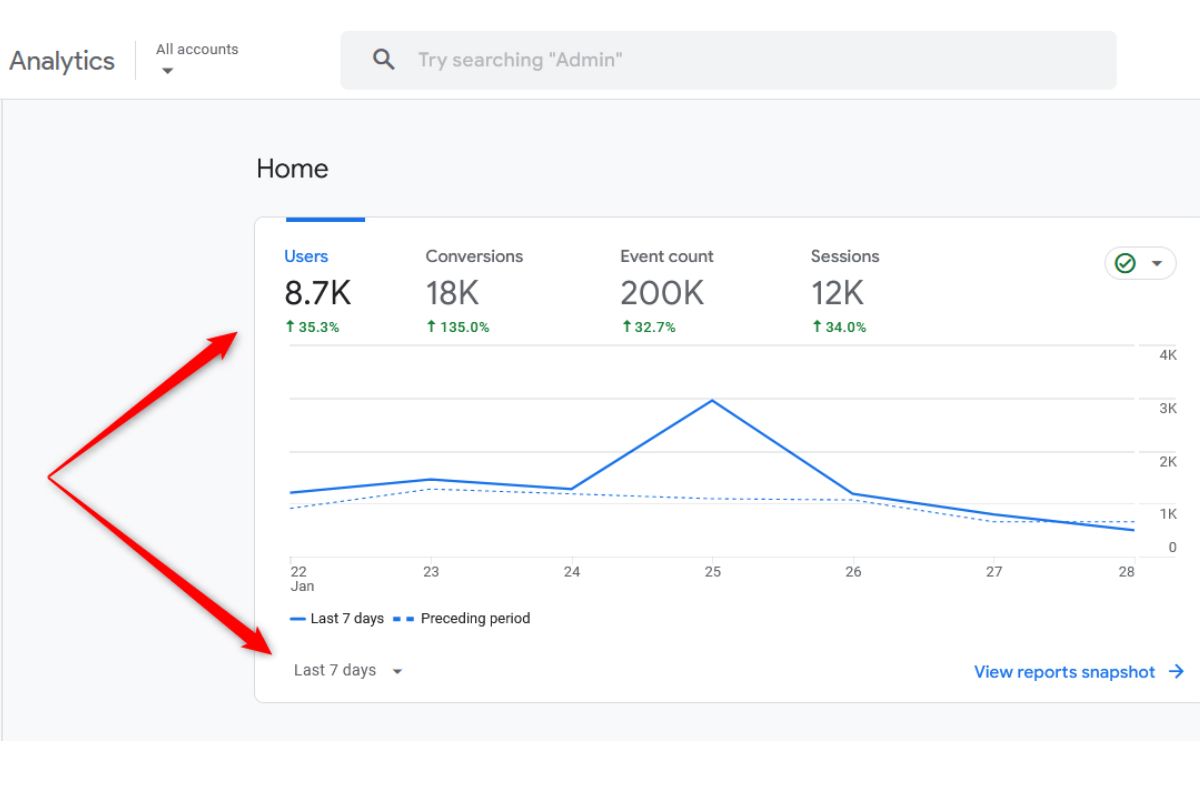
2.1. Organic Traffic
Organic traffic reflects the number of users visiting your content from search engines. It’s a direct indicator of your content’s visibility and relevance within search engines (SEO). For example: A blog post about “Eat clean recipes” ranks on Google and receives 4,500 monthly visits without ads. That’s organic traffic driven by SEO.
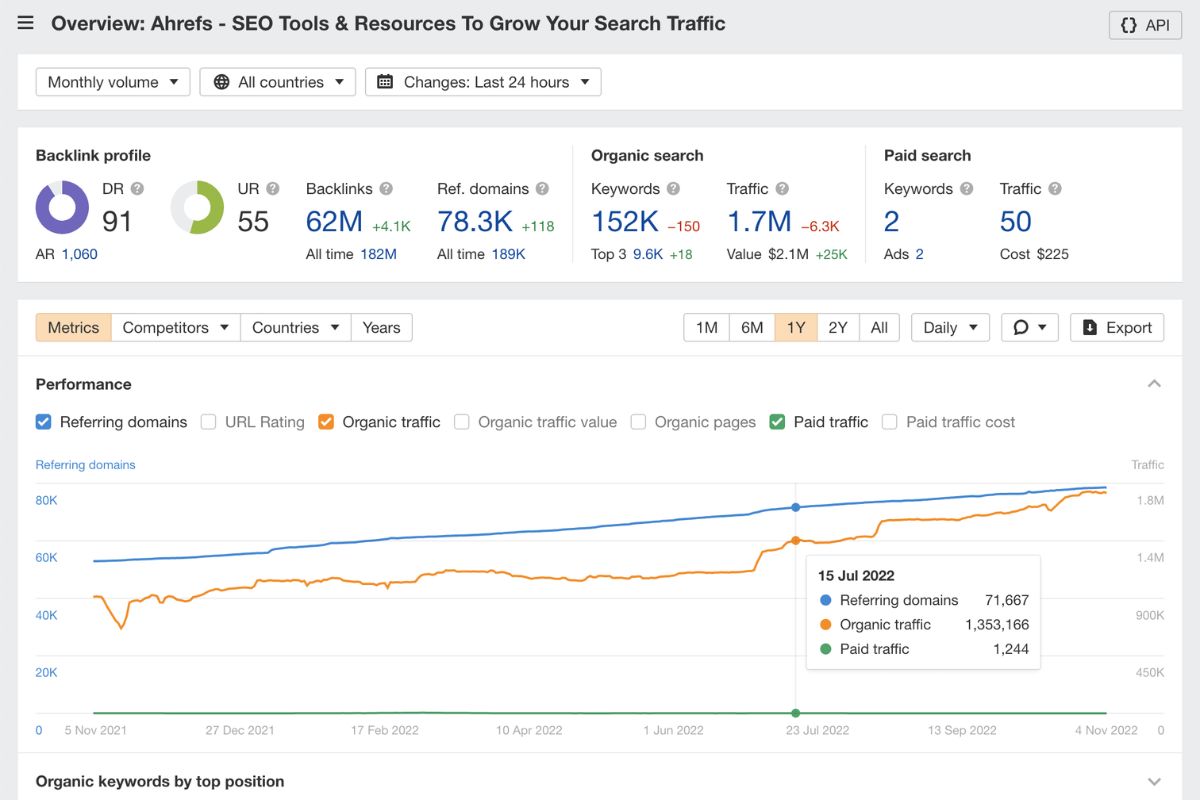
This measures how many users land on your content via search engines like Google
To effectively track trends, you can leverage tools like Google Analytics, Ahrefs, and Google Search Console.
Pro tip: To determine what is driving discovery, measure organic traffic by content type (blogs, landing pages, and resources).
2.2. Impressions
Impressions indicate how often your content appears in search engine results, regardless of clicks by users. It’s a measure of potential audience size, giving you valuable insights into the possible reach of your content or ads.
Impressions help measure content visibility before clicks or conversions
For example, a high impression count with low CTR might prompt you to revisit meta titles or ad copy.
2.3. Clickthrough Rate (CTR)
CTR is the ratio of clicks your content receives to the number of impressions it gets. A high CTR indicates that your title tags, meta descriptions, and calls-to-action (CTAs) are compelling and relevant, encouraging users to click through to your content.
| CTR = (Clicks / Impressions) × 100 |
For example, if your SaaS landing page appeared 8,000 times and got 320 clicks, the CTR is 4%. This means 4% of users who saw the page actually clicked to learn more or sign up. These metrics show that your headline and meta description are resonating with your target audience.
2.4. Content-Assisted Demos
Content-assisted demos measure how many product demos are influenced or directly driven by users interacting with your content. This metric helps justify content’s role in sales enablement and pipeline acceleration.
For example: A visitor reads your comparison page on your website, then fills out the demo request form. That counts as a content-assisted demo.
2.5. Bounce Rate
Bounce rate (BR) shows the percentage of visitors who leave your site after viewing only one page – without clicking further or taking any action.
| BR = (Total one-page visits/ Total visitors) × 100 |
For example, if 1,000 people visit a blog post and 600 of them leave without exploring other pages, your bounce rate is 60%.
- Typical range: 35% – 55% for main SaaS websites.
- B2B SaaS: Often lower, 25% – 35% for targeted audiences.
- Content/Blog Pages: Higher is normal, 70% – 90% is common for blogs
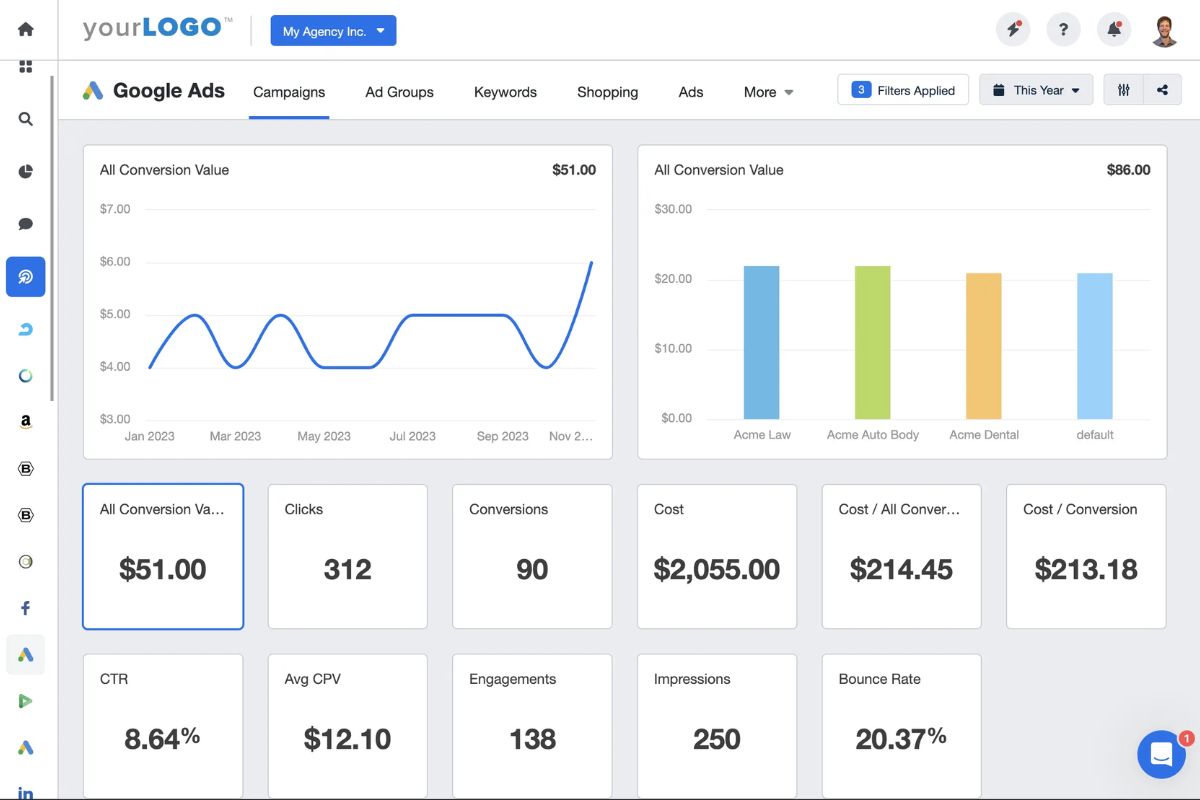
2.6. Customer Acquisition Cost (CAC)
Customer Acquisition Cost (CAC) measures the total cost of acquiring a new customer, encompassing all marketing and sales expenses divided by the number of new customers acquired within a specific period.
| CAC = Total Marketing Spend / Number of Customers Acquired |
For example, if your SaaS company spent $2,000 on content marketing in a month and gained 20 new customers, your CAC would be $100. That means it costs you $100 in marketing efforts to bring in each customer.
Customer Acquisition Cost (CAC) varies widely, but an average of $702 per customer has been reported for SaaS.
Read more: 12 Leading SaaS Digital Marketing Agencies To Drive MRR Growth (2024)
2.7. Unique Visitors
Unique visitors count the number of individual users who visit your website within a given timeframe, regardless of how many times they visit. This metric provides a clear picture of your audience size and brand awareness.
You can use tools like Google Analytics to easily track unique visitors
2.8. SERP Ranking
SERP (Search Engine Results Page) ranking refers to where your content appears in search engine results for a specific keyword. The higher your ranking, the more likely users are to see and click on your content.
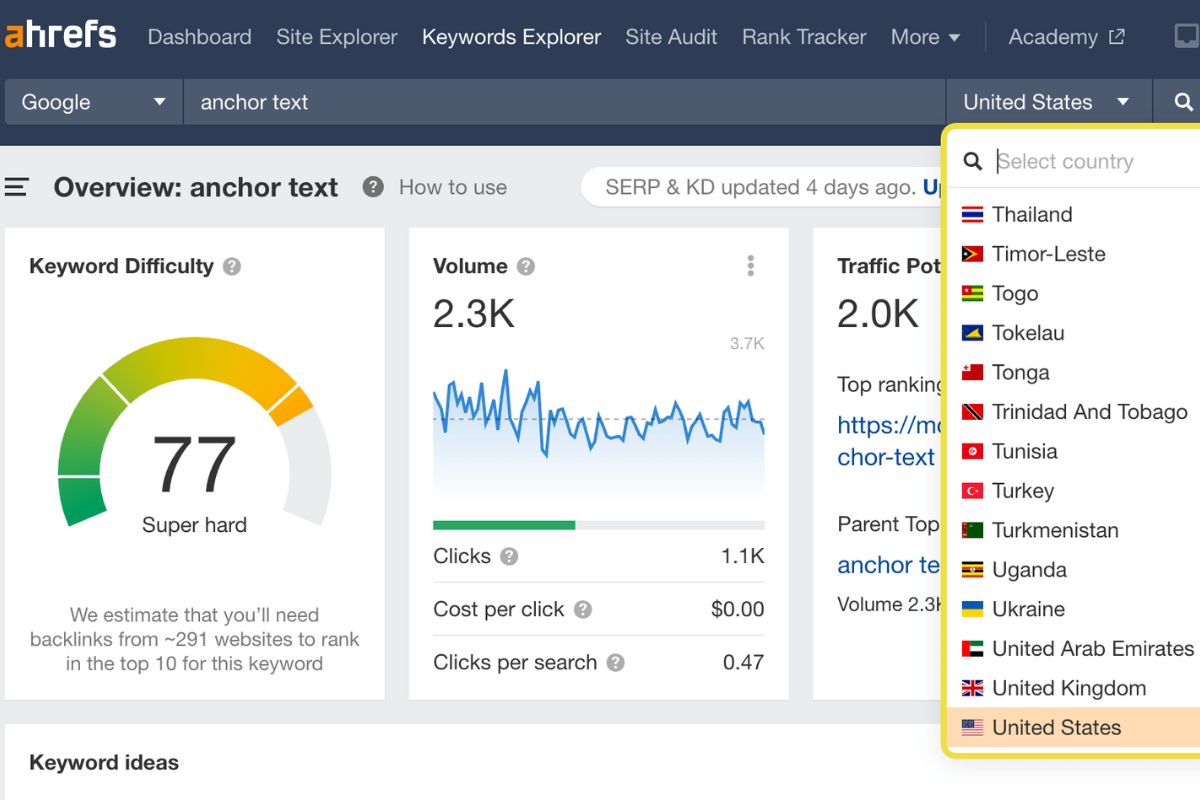
A strong SERP position makes your content more visible to users actively searching for relevant topics
For example: Your article on “Best Sunscreens for Oily Skin” ranks #2 on Google for that keyword and also appears in the “People Also Ask” section. This high SERP position boosts both visibility and clicks.
Tip: You should keep an eye on featured snippets and “People Also Ask” boxes to increase your visibility beyond traditional rankings.
2.9. Pages Per Session
Pages per session (or pages per visit) shows how many pages a visitor views after landing on a content page. A high number suggests strong internal linking and compelling content.
Benchmark: For SaaS websites, 1.5 – 2.5 pages per session is typical. Higher values indicate strong internal linking and content engagement.
2.10. Average Time on Page
Average Time on Page measures the average amount of time visitors spend on a specific page. Longer average time on page typically signifies that users are actively reading and consuming your content, suggesting high engagement and relevance.

Average time on page in some specific industries
Let’s consider that you’ve published a detailed blog post on “Top Digital Marketing Trends for 2025.” A few weeks after it goes live, you observe that the average time on page is 5 minutes. This suggests readers are engaging deeply with the content and finding it useful.
2.11. Traffic Source
Traffic Source is the origin where your website visitors come from (organic, social, referral, email), helps you identify which channels drive the most value, so you can double down on what’s working best.
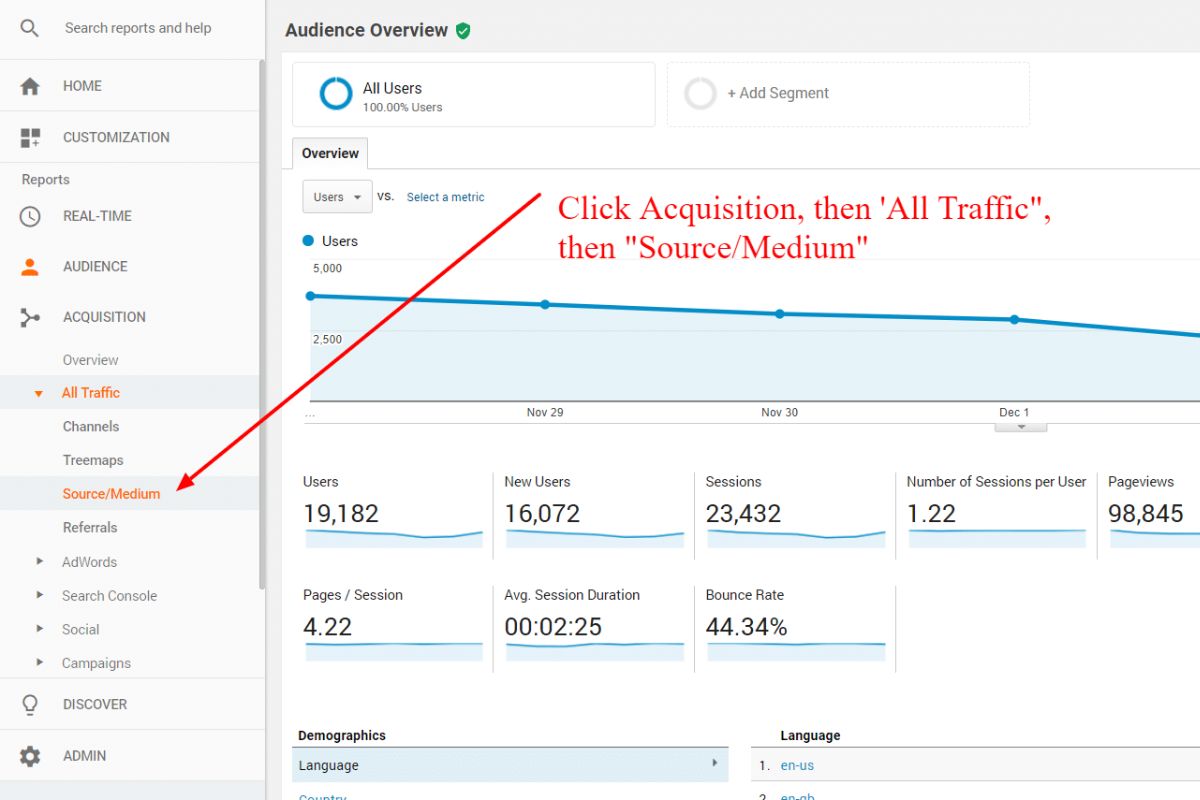
Knowing traffic sources shows which channels to scale and which to cut
For example, if organic drives 70% of traffic but social only 6.5%, your content repurposing strategy may need improvement.
2.12. Scroll Depth
Scroll depth measures how far readers scroll on a page. If users only scroll 30% down, it might mean your intros are too long or formatting is hard to scan.
Using tools like Hotjar or Microsoft Clarity visualize this with heatmaps
2.13. Lead Quality
Lead Quality measures how well the leads generated by your content align with your ICP (ideal customer profile). By evaluating whether leads are MQLs (Marketing Qualified Leads) or SQLs (Sales Qualified Leads), you can understand their true value to the sales team and prioritize follow-ups more effectively.

High-quality leads allowing the sales team to focus on those more likely to convert
Let’s consider that you’ve launched a gated whitepaper titled “Cloud Security Strategies for Fintech Companies”. Two weeks later, you notice that most of the leads downloading it are senior security officers at mid-to-large fintech firms – a strong match with your ICP.
2.14. Conversion Rate
| CR = (Number of Conversions / Total Visitors) x 100 |
Conversion rate is the percentage of visitors who complete a desired action (download a guide, book a demo, sign up,…) after interacting with your content.
2.15. Customer Lifetime Value (CLTV)
| CLTV = Average Revenue per Account × Customer Lifetime |
Customer Lifetime Value (CLTV) is one of the most crucial SaaS metrics to compare with Customer Acquisition Cost (CAC). The total revenue a customer is anticipated to generate during their association with your business is known as CLTV.
Analyzing CLTV in conjunction with content-driven acquisition aids in determining which content strategies draw in high-value, enduring clients, even though it is not a direct content marketing metric.
LTV:CAC Ratio Benchmark: A healthy SaaS business typically maintains an LTV:CAC ratio of at least 3:1 (i.e., CLTV is at least 3x CAC)
2.16. Content ROI
Content ROI measures the return you get from your investment in content marketing. It assists you in determining which content initiatives truly add value to your business and where to allocate your funds for the greatest possible impact.
Content ROI helps marketing teams prove the value of their work to stakeholders
How to Measure Content ROI:
| Content ROI = (Revenue Attributed to Content – Content Costs) / Content Costs |
For example, if a SaaS company spends $1,000 on a content campaign and generates $5,000 in revenue from leads acquired through that content, the ROI is 400%. This demonstrates that the campaign was very successful and deserving of expansion.
| Metric | Meaning / Primary Application | Measurement Tools |
| Organic Traffic | Measures visibility and SEO effectiveness | GA4, GSC, Ahrefs |
| Impressions | Measures potential reach | GSC, Ahrefs |
| CTR | Evaluates the attractiveness of titles/meta descriptions | GSC, GA4 |
| Content-Assisted Demos | Measures content’s impact on sales | CRM, HubSpot |
| Bounce Rate | Evaluates audience retention | GA4 |
| CAC (Customer Acquisition Cost) | Calculates customer acquisition cost | CRM, GA4 |
| Unique Visitors | Measures brand awareness | GA4 |
| SERP Ranking | Tracks keyword positions | Ahrefs, SEMrush |
| Pages Per Session | Measures content engagement and internal linking quality | GA4 |
| Avg. Time on Page | Measures interaction level | GA4 |
| Traffic Source | Identifies most effective channels | GA4, HubSpot |
| Scroll Depth | Measures how deeply users read the content | Hotjar, Clarity |
| Lead Quality | Assesses lead relevance | CRM, HubSpot |
| Conversion Rate | Measures conversion effectiveness | GA4, HubSpot |
| CLTV (Customer Lifetime Value) | Measures total customer value over time | CRM |
| Content ROI | Measures profit generated from content | GA4, CRM, HubSpot |
Further Reading:
3. Metrics vs. KPIs: What’s the Difference?
While often used interchangeably, “metrics” and “Key Performance Indicators (KPIs)” have distinct roles in measuring content marketing success for SaaS.
| Comparison Criteria | Metrics | KPIs |
| Purpose | Metrics are individual data points that help monitor specific aspects of performance. | KPIs (Key Performance Indicators) are strategic metrics directly tied to your business goals. |
| Scope | Tactical and detailed | Strategic and outcome-focused |
| Strategic Focus | Less strategic, often descriptive of operational status. | Highly strategic, serving as a direct measure of strategy success. |
| Examples in SaaS Content Marketing | – Page Views
– Average Time on Page – Bounce Rate – Social Shares – Unique Visitors |
– Customer Acquisition Cost (CAC)
– MQL to SQL Conversion Rate – Content-to-Trial/Demo Conversion Rate – Content ROI (Revenue influenced by content) – Customer Lifetime Value (CLTV) |
→ In essence, all KPIs are metrics, but not all metrics are KPIs. KPIs are the metrics you deem most important for evaluating progress towards a defined business goal, providing actionable insights for strategic decision-making.
4. How to Track and Analyze Content Marketing Metrics for SaaS
Tracking content performance in SaaS isn’t just about gathering numbers—it’s about understanding what those numbers actually mean for your business. If you don’t have clear goals or a process to interpret the data, even the most impressive-looking metrics won’t lead to real improvements.
To make measurement actionable, you need the right tools and processes:
- Google Analytics 4 (GA4) – for traffic, user behavior, conversions.
- Search Console – for organic performance and technical SEO.
- HubSpot/ Marketo – for lead tracking and attribution.
- Hotjar/ Clarity – for UX insights like scroll and click heatmaps.
- Ahrefs/ SEMrush – for keyword rankings and backlink analysis.
- Factors.ai or Dreamdata.io – for multi-touch attribution in SaaS.
Using the right tools is crucial to accurately track how prospects interact with content across multiple touchpoints
Establish routines that convert data into decisions after you have your tools in place:
- Make dashboards specifically for monthly and weekly performance evaluations. Regular data visualization enables you to identify patterns early and take preventative action.
- Divide your data according to buyer personas, acquisition channels, or funnel stages (TOFU, MOFU, and BOFU) to learn how various audiences respond to various kinds of content.
- To link traffic shifts to particular actions, use annotations to mark important events, such as the launch of new content, algorithm updates, or campaign modifications.
- Configure automated notifications for anomalous declines in engagement, traffic, or keyword rankings. These indicators frequently point to more serious problems like lost links, broken pages, or indexing issues.
👉 Read more: 25 Proven SEO Techniques to Boost Your Rankings in 2025
5. Actionable Tips to Optimize SaaS Content Based on Data
Leveraging data for optimization is where your content marketing truly gains momentum. Here are actionable tips:
- Transform high-performing content into different formats for a range of touchpoints.
- To improve SEO and engagement, audit and update underperforming posts on a regular basis.
- To produce more assets in those formats, concentrate on what converts and use conversion data.
- Create bottom-of-funnel assets, such as case studies and comparison pages, in coordination with sales.
- To maximize performance and make continuous improvements, run A/B tests.
- To improve user engagement and SEO strategy, create topic clusters for UX and SEO.
>>Read more: How to Do a SEO Technical Audit? 10 Steps of a Technical SEO Audit
6. Conclusion
Knowing how to measure SaaS content marketing is now essential for long-term success. You can transform content from a cost center into a high-performing engine that draws in, develops, and converts the right kind of clients with the correct combination of metrics, tools, and continuous analysis.
At Golden Owl Digital, we specialize in helping SaaS businesses turn content into revenue. From building full-funnel content strategies to implementing tracking systems and optimizing for ROI – we’ve helped dozens of brands grow with data-backed, performance-driven marketing.

Jaden is an SEO Specialist at Golden Owl Digital. He helps brands rank higher with technical SEO and content that resonates