If you’re asking how much do meta ads cost, the hard part is deciding which cost should shape your budget: a bargain click can still come with a far costlier purchase.
The benchmarks and budget guidance ahead will help you choose what to fund, account for industry and auction differences, and judge results against the revenue your ads need to bring in. Use it as a practical answer to how much do Meta ads cost in 2026, by metric and by industry.
How Much Do Meta Ads Cost Across Key Benchmarks
Meta ad costs vary by metric and campaign, so the benchmarks below show ranges rather than one universal price. Meta ads benchmarks average millions of campaigns, but mix objectives, audiences, and levels of creative quality (which makes one average CPC hard to use). One average salary figure has the same problem.
Treat benchmarks as orientation, not a prediction: costs land somewhere within a range, and the factors in the next sections help explain where. Compare like-for-like datasets.
Cost per Thousand Impressions
CPM
CPM is what you pay for 1,000 ad views; from August 2025 to July 2026, the median eCommerce brand paid $15.06, up 13% from a year earlier. Health & Wellness was among the priciest categories at $21.80; Baby was cheapest at $11.50.
A good Meta CPM
A good Meta CPM in 2026 is about $8-$12. Under $10 is strong, while $10-$18 is typical; above $20 can point to narrow targeting or a high-cost vertical such as finance and insurance. For a broader benchmark, see what is a good cpm for meta ads.
Databox’s cross-industry median
Databox’s cross-industry median is $7.26 (it covers a broader mix of objectives and markets). Between that figure and the other benchmark is normal territory.
The comparisons show Facebook and Instagram CPMs, plus Facebook impressions per $1,000, vary by audience country: United States, Canada, Australia, United Kingdom, Germany, and India.
| Audience country | Facebook CPM | Instagram CPM | Impressions per $1,000 on Facebook |
|---|---|---|---|
| United States | $16.00 to $21.00 | $20.00 to $28.00 | About 48,000 to 62,000 |
| Canada | $11.00 to $14.50 | $14.00 to $18.00 | About 69,000 to 91,000 |
| Australia | $11.00 to $14.00 | $14.00 to $18.00 | About 71,000 to 91,000 |
| United Kingdom | $10.00 to $13.00 | $13.00 to $17.00 | About 77,000 to 100,000 |
| Germany | $8.00 to $11.00 | $10.00 to $14.00 | About 91,000 to 125,000 |
| India | $1.00 to $1.80 | $1.50 to $2.80 | About 556,000 to 1,000,000 |
Country ranges show CPM benchmarks differ across the listed audiences and placements.
Cost per Click
CPC
CPC is what you pay for one click. For United States traffic campaigns, the median click cost was $0.60 between April 2025 and June 2026, down 14% from a year earlier.
Traffic campaigns
Traffic campaigns had a median CPC of $0.60, down from $0.70 the year before.
Lead campaigns
Lead campaigns paid $1.80 per click. Traffic campaigns had the cheapest clicks at $0.60, while Lead campaigns paid $1.80 per click and $27.39 per lead; Sales campaigns paid about $39 per purchase. In Ads Manager, check the objective: it changes what you pay for, so two campaigns in one account can have very different costs.
Cost per Acquisition
A cost per purchase is the ad spend needed to make one sale; from August 2025 to July 2026, the median eCommerce brand paid $38.99. That was just 3% more year over year (CPMs rose 13%). A 2.39% click-through rate offset most of that increase, even as conversion rates fell to 1.53%.
At the median, Lead campaigns paid $27.39 per lead; Career & Employment had the cheapest leads at $12.30, while dentists had the most expensive at $61.56.
The cheapest click can still be the wrong bargain: it may bring visitors with no intent or ability to buy. A lower click price looks good at first (but tells you nothing about whether the campaign makes money). Break-even CPA = Average Order Value × Gross Margin %.
How Much Do Meta Ads Cost by Industry
Meta Ads costs vary sharply by industry: food & beverage CPMs start at $8.14, while finance and insurance can top $20; the all-industry average is $14.19. The auction helps explain the spread (Conversion-optimized campaigns target users with demonstrated purchase intent, and those users command premium prices). The figures show higher costs in some industries, but they don’t establish which industry traits drive the difference.
Use the table to compare average CPM, CPC, CTR, and CPA across the listed industries.
| Industry | Avg CPM | Avg CPC | Avg CTR | Avg CPA |
|---|---|---|---|---|
| Insurance | $21.40 | $2.98 | 1.24% | $198.42 |
| Legal Services | $20.85 | $3.45 | 1.38% | $187.60 |
| Healthcare | $18.90 | $2.71 | 1.33% | $156.88 |
| Finance | $18.60 | $3.77 | 1.42% | $77.42 |
| Financial Services | $16.75 | $3.18 | 1.36% | $142.35 |
| B2B Technology | $15.20 | $2.52 | 0.78% | $55.21 |
| Home Services | $13.40 | $1.62 | 1.48% | $89.45 |
| Electronics | $12.88 | $0.89 | 1.34% | $49.48 |
| Home & Garden | $11.67 | $0.73 | 1.58% | $35.82 |
| Real Estate | $11.20 | $0.95 | 2.75% | $44.19 |
| Travel & Hospitality | $10.90 | $0.61 | 1.62% | $31.20 |
| General eCommerce | $10.42 | $0.67 | 1.55% | $32.14 |
| Lifestyle & Boutique | $10.15 | $0.58 | 1.72% | $29.99 |
| Beauty & Cosmetics | $9.80 | $1.81 | 1.45% | $25.49 |
| Apparel & Fashion | $9.23 | $0.45 | 1.95% | $24.32 |
| Fitness | $8.90 | $1.90 | 1.01% | $13.29 |
| Food & Beverage | $8.14 | $0.52 | 1.68% | $23.88 |
| Education | $7.60 | $1.06 | 0.73% | $7.85 |
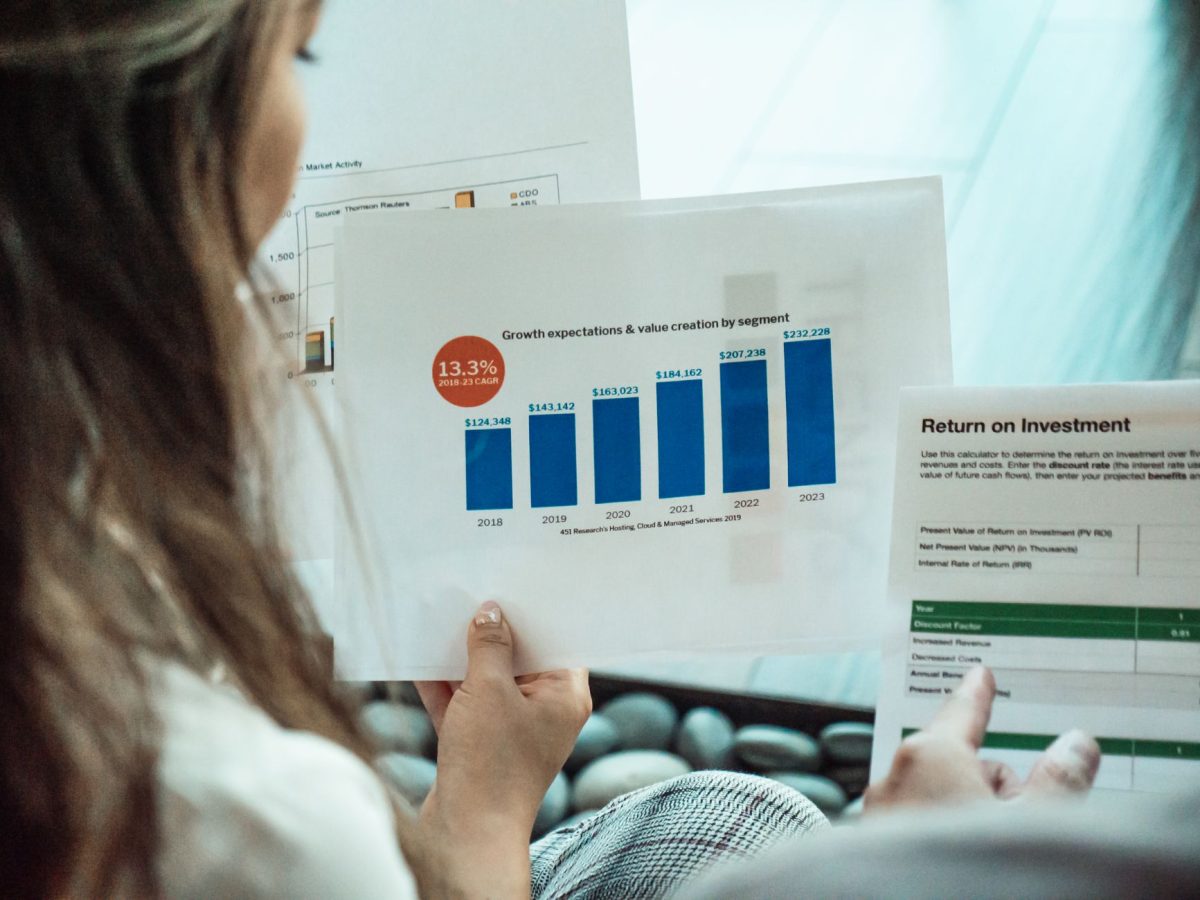
Costs vary across industries and across all four metrics; there’s no single industry-wide price.
Narrow audiences with high value often cost more to reach because several brands bid for the same people. Mass-market niches such as food or apparel may reach bigger audiences, but audience size alone doesn’t establish that they face less competition or pay less.
Some service businesses may face higher Meta Ads costs, but the figures here don’t establish that longer sales cycles or trust-building are the reason. Customer lifetime values can justify premium acquisition spending (though prospects may need extensive nurturing across multi-touch journeys before converting). Higher customer lifetime values partly offset those costs.
How Meta Ad Pricing Works
Meta’s auction determines ad costs by scoring eligible ads on bids and expected usefulness to each person. Meta scores eligible ads based on what advertisers are willing to pay and how useful it expects each ad to be to that person (the score uses both the bid and expected response). That score shapes Facebook ads cost.
Meta’s ad auction documentation says the winning ad has the highest Total Value, combining the bid, Estimated Action Rate, and Ad Quality. Meta also says its adjustments will never charge you more than your bid. Total Value = Bid × Estimated Action Rate × Ad Quality Relevance is part of that calculation, so a more relevant ad can beat a higher bid.

Impressions go to the ad with the highest Total Value score; the highest bidder does not automatically win. Improve the estimated action rate, the likelihood that your specific audience will take the desired action, or ad quality, which reflects how positively people respond to your creative, to lower cost per result without changing your bid. A higher estimated action rate lets Meta win those same impressions at a lower effective cost, reducing your actual cost per result without changing a targeting setting or bid. The auction still compares Total Value.
Meta treats a daily budget as a target for the week, which runs from Sunday to Saturday. On good days, it may spend up to 75% more than the daily figure, but the limit is 175% of that figure in one day and seven times the figure in one week. A $100 daily budget, for example, could cost $175 on a busy Tuesday, while the week’s total stays at or below $700. A lifetime budget follows the same approach across a fixed flight.
How Much Budget Do Meta Ads Need?
Because Meta’s technical floor is about $1 a day, it can look like a test costs almost nothing; the real floor depends on your currency and charges. Give each ad set $5-10 a day for 7 days before judging it. For a low-spend exploratory test, $10-15/day is a starting point, not a conversion-learning budget; use the event-based calculations below to size conversion tests. The platform floor remains low.
Meta’s performance-goal guide calls for a daily budget of at least ten times the average cost of your goal. So a $5 click goal means setting aside at least $50 a day.
The Learning Phase Budget Formula
The minimum weekly budget is 50 events × Target CPA, and the daily minimum is (50 × Target CPA) ÷ 7. To set a Learning Phase budget, run the weekly and daily calculations below.
Minimum weekly budget = 50 events × Target CPA
Daily minimum = (50 × Target CPA) ÷ 7
For a sales ad set, work out the daily minimum by multiplying 50 by the Target CPA and dividing by 7, using 50 events × Target CPA for the weekly amount. With too few conversion signals, the delivery algorithm has to guess, and you’re paying for those guesses.
The table maps benchmark costs to weekly and daily budgets for roughly 50 results across the listed goals.

| Goal | Benchmark cost per result (US) | Weekly budget for about 50 results | Daily budget |
|---|---|---|---|
| Link clicks (traffic) | $0.60 per click | About $30 | About $4 |
| Leads (lead campaigns) | $27.39 per lead | About $1,370 | About $196 |
| Leads, low-cost industry (career and employment) | $12.30 per lead | About $615 | About $88 |
| Leads, high-cost industry (dentists) | $61.56 per lead | About $3,078 | About $440 |
Triple Whale’s $38.99 median puts a purchase goal near $1,950 a week. In a sales example with a $90 average order and $30 target cost per purchase, calculate $30 × 50 ÷ 7: that’s about $214 a day for one ad set, or around $6,500 a month.
Monthly Budget Planning
Budget allocation
Split spending with the 50-30-20 rule: put 50% into proven winning campaigns, 30% into scaling tests, and 20% into new experiments. Set industry-specific multipliers within each share; finance, the high-competition example, should budget 1.5-2x the benchmark for initial testing. When core campaigns bring steady returns, leave most media spend on proven ads and set aside a modest amount to test fresh creative angles. Keep most spend on proven ads.
Scenario modeling
Scenario modeling gives you a way to plan cash flow and set expectations with stakeholders. Lay out three cases: a conservative case using the industry benchmark CPA, then set an optimistic estimate at 20% below the benchmark and a pessimistic estimate at 30% above it.
Measured scaling
When a campaign keeps its cost per result steady, raise its budget in measured steps. Meta warns that frequent changes can send an ad set back into learning.
How to Lower Meta Ad Costs
You can work to lower Meta ad costs by consolidating ad sets, refreshing creative, editing less often, timing tests, qualifying leads, and measuring all-in cost per sale. Each change addresses an input Meta scores in its ad auction.
- Consolidate ad sets. Put more budget behind fewer ad sets so they can reach about 50 results a week sooner and leave the learning phase.
- Refresh creative on a schedule. For active campaigns, plan new ads every two to four weeks instead of waiting for results to fall.
- Edit less often. Big budget jumps and audience changes reset learning, so change one thing at a time and give it a week.
- Time your tests. CPMs rise 30% to 60% from October to December, so run experiments outside those months.
- Qualify leads in the form. Add a question or two; cost per lead rises slightly, but wasted sales time drops a lot.
- Measure all-in cost per sale. Include fees and creative to compare channels and agencies fairly.
Frequently Asked Questions
Is Meta ads free or is there a minimum budget?
Ads Manager itself is free; charges cover the ads you run, along with taxes and 2-5% location fees in six countries. Meta’s technical floor for a daily budget is $1, but generating any useful signal generally calls for at least $10-15/day.
Why are Meta ads getting more expensive?
Meta reported that average price per ad rose 14% in Q3 2026, while ad impressions increased 10%; those figures show the changes, not what caused them.
How much does a Meta ads agency charge?
Agencies commonly set management fees for Meta ads at 10% to 25% of ad spend, with their published minimum monthly rates starting near $1,000. For the first month, one agency charges $1,975 for Facebook advertising management.
Do Meta ad costs increase during Q4?
Q4 costs rise. In 2025, the median CPM stood 59% above September’s in Black Friday week, then reached 84% more than September’s level on Black Friday itself. Conversion rates rise too, meaning cost per purchase may nevertheless fall by about 20%.
How long before Meta ads become profitable?
There is no fixed timeline for Meta ads to become profitable; profitability depends on whether results meet your revenue-based targets, not on the learning or testing clock alone. The first two weeks generally serve as the learning phase, as the algorithm tests what to show; costs commonly exceed their eventual steady-state level, and results stay inconsistent. By weeks three through six, costs settle and CPAs begin to show the account’s real potential. Finding the best creative and audience pairing through practical campaign tuning typically takes 2-3 months of consistent testing.
Bid tricks alone have less effect on Facebook ad costs than adding creative, cleaning up signals, keeping campaigns steady, and setting targets tied to revenue.
Conclusion
There is no useful universal answer to “how much do meta ads cost”; the right spend depends on the result you need and what your account can support. Ads Manager has no fee, but ad spend, taxes, location fees, and agency management all affect the bill. Results can be inconsistent early in the learning phase, then CPAs begin to reflect the account’s real potential. Q4 CPMs can rise as conversion rates rise, too. Tie your targets to revenue. Revisit how much do Meta ads cost for your account every quarter, because CPMs, competition, and your own conversion rates keep shifting.