

B2B marketing budgets are under more pressure than ever with rising CAC, volatile paid media, and imperfect attribution. Yet many teams still spread budgets based on habit rather than performance.
The 70 20 10 rule in digital marketing offers a simple but disciplined way to allocate resources. This article breaks down its 3 allocation tiers, and outlines 5 practical steps B2B teams can use to apply it for more predictable pipeline performance.
Key takeaways:
|
What is the 70 20 10 Rule in Digital Marketing?
Markets move fast. Channels saturate, algorithms shift, and what generated pipeline last year can quietly lose efficiency. That’s exactly why the 70 20 10 rule in digital marketing exists.
It gives teams a structured way to balance predictable performance with controlled experimentation.
Origins and concept of the 70 20 10 model in marketing
The concept originally comes from learning and development research in the 1980s and 1990s, where performance improvement was broken into three sources:
- 70% from hands-on experience
- 20% from collaboration and feedback
- 10% from formal training.
Over time, marketers adapted the same logic to budget and resource allocation.
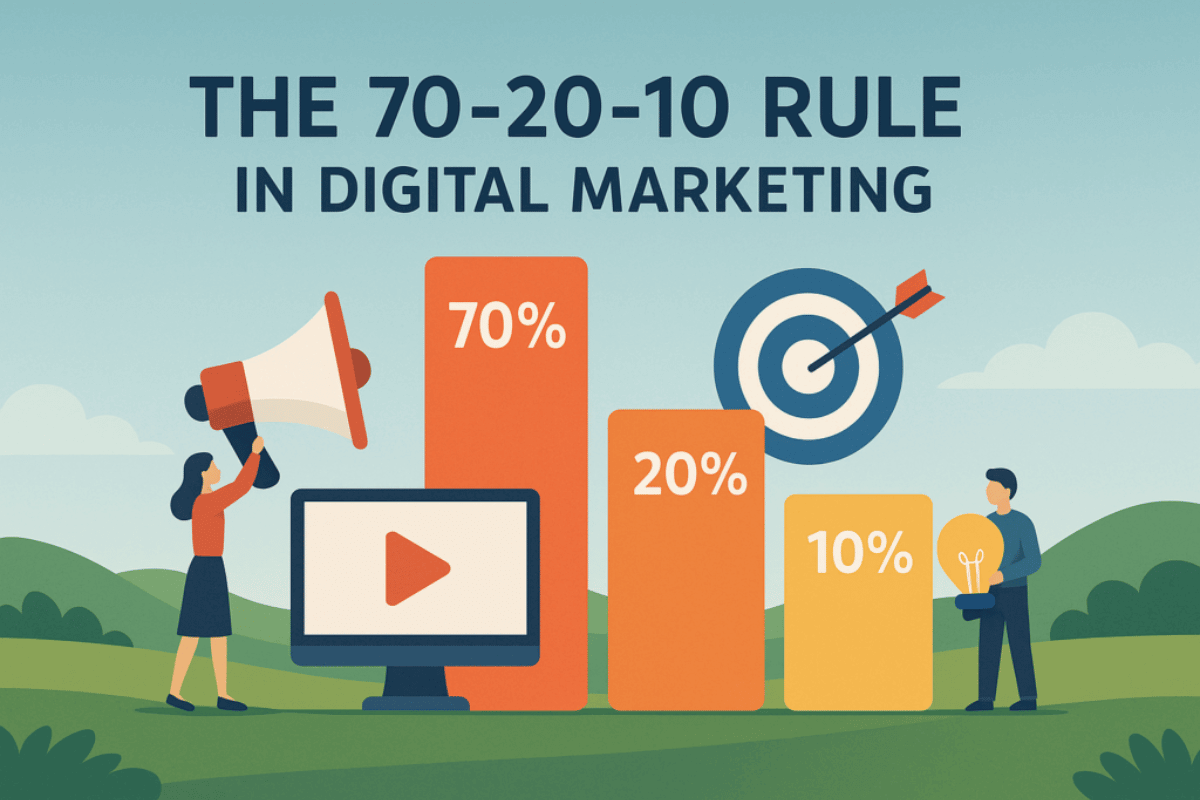
In digital marketing, the 70 20 10 rule means dividing your efforts into three tiers:
70% Core Activities
This is where stability lives. Proven channels and campaigns that consistently generate revenue, qualified leads, or measurable ROI.
For most B2B teams, this often includes SEO-driven demand capture, branded search, retargeting, or established email sequences.
20% Growth & Optimization
This layer improves what already works. You refine messaging, expand to adjacent audiences, test new ad creatives, optimize landing pages, or scale high-performing keywords.
10% Experiments & Innovation
This is controlled risk. New platforms, new content formats, AI-driven tools, emerging channels, or untested campaign angles. These initiatives may fail, and that’s expected.
The goal here is learning and discovering the next future 70%.
Breakdown of the core, experimental, and innovative content groups
The Three Core Groups
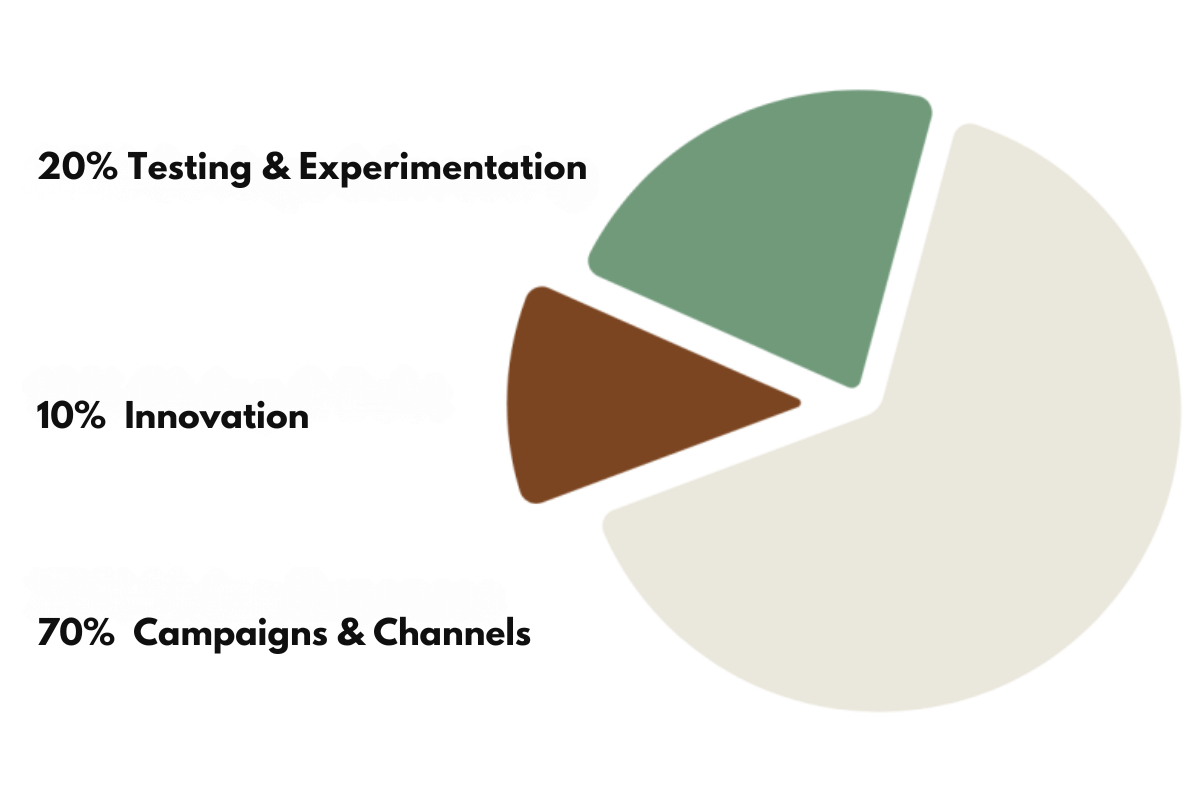
In digital marketing, the 70 20 10 breakdown generally looks like this:
- 70% – Core Content or Proven Channels: The majority of your effort goes into strategies that are tested, reliable, and drive consistent results.
- 20% – New Ideas with Moderate Risk: These are initiatives that are slightly experimental but still have some backing or data.
- 10% – Big Bets / High-risk Innovation: The smallest portion is reserved for high-risk, high-reward campaigns.
The Meaning and Budget Allocation of the 70 20 10 Rule
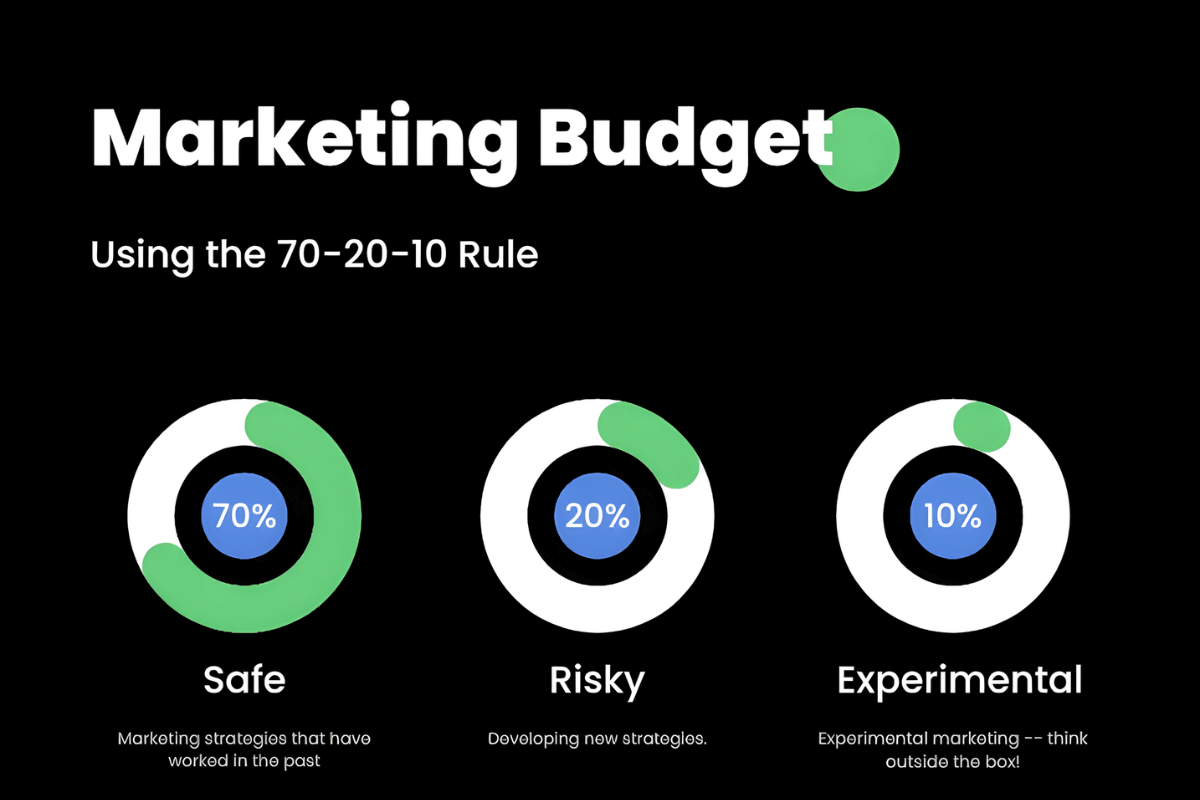
Marketing budget divided into 70% core, 20% testing, and 10% innovation
Applied to budget, the math is straightforward. If a company spends $10,000 per month on marketing:
- $7,000 supports proven, revenue-generating campaigns
- $2,000 funds structured testing and optimization
- $1,000 backs experimental initiatives with clear success criteria
Why the 70 20 10 Rule Matters in 2026
In 2026, the 70 20 10 rule matters because it provides structure in a landscape where AI automation and uncertainty dominate.
Here are the key advantages, viewed through today’s realities.
- Stability in an Era of AI-Driven Media Buying
Automated bidding and audience expansion can scale campaigns quickly, but they can also over-concentrate spend in narrow segments. The 70% allocation anchors budget in historically validated channels. This protects revenue while platforms optimize in the background. - Risk Control Amid Rising Paid Media Volatility
CPC and CPM swings have become more frequent across major platforms. By limiting experimental activity to 10%, teams avoid exposing large portions of budget to unstable or unproven tactics. Revenue forecasting becomes more reliable. - Smarter Decision-Making in a Cookieless Environment
With the evolution of cookieless tracking and privacy-first analytics, attribution models rely more on first-party data and probabilistic modeling. The 20% bucket allows teams to test new measurement approaches without destabilizing core performance. - Protection Against Platform Automation Risk
When every competitor uses the same automated campaign types, differentiation narrows. The structured 10% experimentation layer gives space to test new creatives, audiences, and channels that automation alone does not surface. - Continuous Efficiency Gains Through Optimization
The 20% growth allocation focuses on improving what already works. That means refining targeting, improving landing page conversion rates, and enhancing messaging.
In high-CAC B2B markets, incremental efficiency often produces a stronger impact than chasing new channels.
How to Apply the 70 20 10 Rule in Content and Channel Strategy
Content Strategy Allocation
In B2B environments, content strategy supports demand capture, nurturing, and sales enablement. The allocation should reflect that.
| Allocation | Content Type | Primary Objective | Typical KPI |
| 70% | Evergreen SEO pages, product-led content, case studies, solution pages, documentation | Stable pipeline contribution | SQL volume, pipeline value, assisted revenue |
| 20% | Expanding keyword clusters, new audience angles, refreshed high-performing assets | Efficiency and reach expansion | Conversion rate lift, MQL cost, incremental traffic |
| 10% | Thought leadership reports, new formats, interactive tools, experimental campaigns | Strategic differentiation and learning | Engagement depth, backlinks, qualified demo requests |
The 70% layer should focus on high-intent search terms, bottom-of-funnel content, and assets that sales teams actively use.
The 20% allocation improves what already works. That may mean updating a high-ranking article to capture adjacent keywords or refining landing pages to improve conversion rates.
The 10% bucket is structured experimentation. That could include AI-generated interactive tools, new content formats, or emerging platforms.
Channel Strategy Allocation
The same logic applies to distribution. Not all channels deserve equal trust.
70% Primary Channels
These are proven revenue drivers. In B2B, this often includes organic search, branded paid search, retargeting, and established email nurture flows. The objective is predictable pipeline generation.
20% Growth Channels
These channels show traction but are not fully optimized. Examples may include LinkedIn Ads for targeted ABM campaigns, expanding into new keyword segments, or scaling remarketing audiences.
The focus here is improving performance without destabilizing core revenue.
10% Experimental Channels
This includes emerging platforms, beta ad formats, or unconventional partnerships. The purpose is discovery, not immediate scale. Budgets in this tier should be capped and time-bound.
Operational Discipline
A channel or content initiative should move from 20% to 70% only after demonstrating consistent ROI or pipeline contribution over multiple reporting cycles. Experiments in the 10% tier need predefined success criteria and stop-loss thresholds.
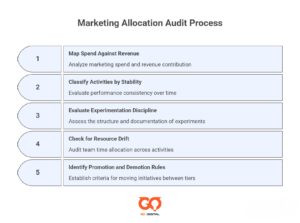
How to Audit Your Current Marketing Allocation
Before adjusting percentages, you need a clear picture of where your budget and effort are actually going.
Step 1: Map Spend Against Revenue Contribution
Pull the last 6 to 12 months of marketing data and build a simple table:
- Channel or content type
- % of total budget
- % of pipeline generated
- % of closed revenue influenced
- CAC or cost per SQL
You are looking for imbalance.
If 30% of your budget produces 70% of your revenue, that’s likely part of your true 70% core. If 25% of spend generates minimal pipeline, that probably belongs in the 10% bucket or needs to be cut.
Step 2: Classify Activities by Performance Stability
Not every initiative should be judged on one good month.
Ask:
- Has this channel produced consistent ROI over at least two to three quarters?
- Does it reliably generate sales conversations?
- Is performance predictable enough for forecasting?
If yes, it belongs closer to 70%.
If performance is promising but inconsistent, it fits 20%.
If results are volatile, unclear, or based on small data samples, it stays in 10%.
Stability is the defining factor.
Step 3: Evaluate Experimentation Discipline
Look at your experimental initiatives.
- Do they have a defined hypothesis?
- Is there a fixed budget cap?
- Is there a time-bound evaluation window?
- Do you document learnings even when ROI is negative?
If experimentation runs without guardrails, the 10% bucket quietly expands and starts eroding core performance.
Step 4: Check for Resource Drift
Budget is only one part of allocation. Team time matters just as much.
Audit:
- How many hours are spent maintaining core channels?
- How much time goes into testing new ideas?
- Are senior team members spending disproportionate time on low-impact experiments?
It is common to see high-performing core activities under-resourced while experimental projects absorb leadership attention.
Step 5: Identify Promotion and Demotion Rules
Every 90 days, review which initiatives should move between tiers.
- If a 20% initiative demonstrates consistent revenue impact, graduate it to 70%.
- If a 70% channel declines in efficiency for multiple cycles, reassess its status.
- If a 10% test fails to show meaningful learning or traction, close it and redeploy the budget.
Measuring, Monitoring, and Adjusting Performance Based on the 70 20 10 Rule
The 70 20 10 rule only works if performance is tracked consistently and budgets move based on evidence.
Each allocation tier should be measured differently:
| Allocation | Key Performance Indicators (KPIs) | Measurement Philosophy | Frequency |
| 70% | ROI, CLV, ROAS, CPA, CAC | Efficiency and Profitability. Is the channel generating reliable returns and optimizing costs? | Monthly/Weekly |
| 20% | MQL cost, Engagement Rate, New Channel Conversion Rate, Time on Site | Validation and Scaling. Can this strategy be profitable enough to move to the 70% bucket? | Quarterly |
| 10% | Lessons Learned, Market Buzz (PR/Mentions), IP Developed, Scalability Score | Learning and Future Potential. Did we gain a competitive insight, regardless of immediate profit? | Bi-annually/Annually |
When to Stop an Experiment
Experimentation only works when exit criteria are clear. Consider stopping or reallocating when:
- The test fails to meet predefined KPIs within the agreed time frame
- CAC exceeds acceptable thresholds without improving trendlines
- Engagement or conversion signals remain statistically insignificant
- Learnings are repetitive and no new insight is generated
Limitations and Important Considerations
While powerful, the 70-20-10 rule is not a flawless dogma. Applying it blindly without considering its potential pitfalls can be detrimental:
- Not all industries fit the model: Some fast-changing industries may need a different ratio or more aggressive experimentation.
- Teams often get stuck in the 70% zone: It’s easy to focus too much on “what’s already working” and ignore innovation.
- Hard to allocate correctly without solid data: If you don’t know which channels perform best, it’s tough to decide what belongs in 70%, 20%, or 10%.
- The 10% innovative bucket carries real risk: New ideas may fail, so they need tight KPI tracking and quick adjustments.
- It’s not a one-size-fits-all formula: Many brands adjust it to 60-30-10 or 80-15-5 depending on goals and budget.
- Requires internal alignment: Without team buy-in, budget and resource allocation can cause conflict.
- Depends on your measurement capability: If you can’t track the performance of each activity group, the model won’t work well.
Flexible Alternatives and Complementary Approaches to the 70 20 10 Rule
Alternative budgeting models such as 50–30–20 or 80–15–5
While the 70-20-10 rule is powerful, modern marketing often benefits from blending it with other established methodologies:
- 60–30–10 Model: Gives more room for experimentation (30%) while still keeping a stable base.
- 80–15–5 Model: Ideal for small teams or tight budgets that need to focus heavily on proven channels.
- 50–30–20 Innovation Framework: Works well for brands in fast-moving industries that need constant testing.
- Test-and-Learn Cycle (TLC): A practical approach where teams run small weekly or monthly tests instead of fixed budget ratios.
- Agile Marketing Sprints: Helps teams adapt faster by planning in short cycles rather than annual budgets.
- OKR-Based Allocation: Budget and tasks shift based on quarterly objectives instead of a fixed percentage rule.
- Pareto + 70/20/10 Hybrid: Focus 80% on top-performing channels (Pareto rule), then apply the 70/20/10 structure inside that 80%.
→ These approaches can complement the 70 20 10 model, particularly when data is scarce or market conditions fluctuate rapidly.
Bottom Line
The 70 20 10 rule in digital marketing is a simple yet powerful framework to balance stability, improvement, and experimentation. When applied thoughtfully, it reduces risk, encourages creativity, and ensures sustainable growth.
For B2B owners, its real value shows up in three areas:
- Revenue predictability: 70% protects the channels that consistently generate qualified pipeline.
- Risk control: 20% and 10% create structured innovation without gambling the entire budget.
- Capital efficiency: Resources shift based on performance, improving CAC and marketing ROI over time.
At Golden Owl Digital, this tiered allocation mindset helps our B2B clients move from reactive spending to performance-driven planning. The goal is a more stable growth engine built on data, discipline, and controlled experimentation.

Jaden is an SEO Specialist at Golden Owl Digital. He helps brands rank higher with technical SEO and content that resonates