According to IoT Analytics, the number of connected devices is projected to exceed 27 billion by 2025, demonstrating the rapid expansion of digital ecosystems. With this data surge, businesses need effective tools to manage and analyze the information flow.
Digital dashboards, also known as liveboards, serve as an essential solution, turning raw data into actionable insights. In this article, we’ll explore what digital dashboards are, provide key examples, and share templates to help you make the most of this powerful business intelligence tool.
What Is Digital Dashboard? Definition and More
What Is A Digital Dashboard?
A digital dashboard is a simple visual tool that helps businesses keep track of important data and performance metrics.
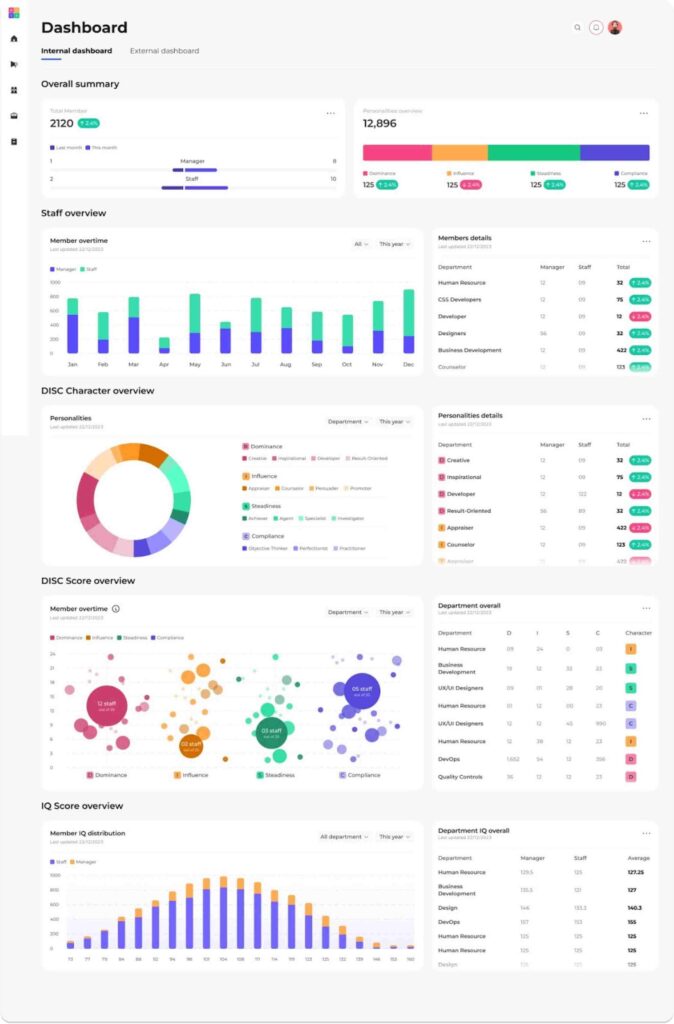
It works like a control panel, displaying key information such as sales numbers, website traffic, or customer satisfaction scores. This makes it easy for business leaders to quickly understand how their company or a project is performing, analyze trends, and make informed decisions. Digital dashboards can pull data from multiple sources and present everything in one clear, easy-to-read format.

Key features of modern digital dashboards
The data about businesses improving decision-making by 5x faster with data analytics is derived from studies on business intelligence adoption, and the statistic on 24 billion connected devices by 2025 comes from IoT Analytics’ forecasts. If you need a deeper dive into these statistics, I can help locate specific sources or reports for further reading!
| Feature | Description |
|---|---|
| Real-Time Data | Access the latest metrics instantly to make informed decisions. |
| Interactive Visuals | Dynamic charts and graphs simplify complex data, helping identify trends quickly. |
| KPIs | Track essential performance indicators to meet organizational goals. |
| Data Exploration | Drill-down features and filters allow deeper analysis of key metrics. |
| Automated Alerts | Get notified about critical data changes instantly. |
| Integration | Combine data from multiple sources into one dashboard. |
| Collaboration | Share dashboards and insights with team members for better decision-making. |
| Mobile-Friendly | Access and interact with dashboards on any mobile device for convenience. |
How To Create A Digital Dashboard For Data Analytics in 10 Days
A digital dashboard is a crucial tool in today’s data-driven environment, enabling businesses to visualize their data and make informed decisions. Below is a clear, step-by-step guide on how to create an effective data analytics dashboard within 10 days.
Step 1: Define Your Business Goals (Day 1)
Before building a digital dashboard, the first thing you must do is identify your business goals. Clearly define:
- What are the key objectives you want to accomplish through data analytics?
- What decision-making gaps exist in your current process?
- What specific insights do you need to make more informed decisions?
Example: A marketing team might define goals to track campaign performance and customer engagement metrics, focusing on KPIs like CTR (Click-Through Rate), customer acquisition cost, and conversion rates.
Step 2: Understand Your Users (Day 2)
Knowing who will use the dashboard is essential. Understand their needs, technical expertise, and expectations:
- What kind of users will be interacting with this dashboard (e.g., managers, analysts, or executives)?
- What level of data visualization or technical detail do they require?
Tip: If your users are non-technical, consider creating a dashboard with simple visuals and interactive elements like filters, but avoid complicated analytics jargon.
Step 3: Collect and Clean Data (Day 3-5)
Once you understand the goals and users, it’s time to collect the data you’ll need:
- Identify relevant data sources (e.g., Google Analytics, CRM systems, sales data).
- Clean the data to ensure it is accurate and consistent. Incomplete or messy data will result in unreliable insights.
Fact: Research shows that poor data quality costs businesses an average of $12.9 million annually, so data accuracy is crucial for meaningful results.

Step 4: Select the Right Data Visualization Tool (Day 6)
There are numerous Business Intelligence (BI) tools available. Your choice should depend on the goals, users, and data complexity. Some popular BI tools include:
- Tableau: Offers strong data visualization and dashboard customization.
- Power BI: An affordable option with solid integration with Microsoft products.
- Google Data Studio: Ideal for companies already utilizing Google Analytics and marketing data.
Fact: A 2023 study showed that 85% of businesses experienced improvements in decision-making after adopting BI tools .
Step 5: Design Your Dashboard (Day 7-8)
Now, start designing the layout of your dashboard. Ensure the design aligns with your goals:
- Prioritize the most important KPIs at the top.
- Use simple and relevant visuals (charts, graphs) to avoid clutter.
- Ensure the dashboard is interactive, allowing users to drill down into the data.
Example: A sales dashboard might include bar graphs for monthly revenue, pie charts for product category performance, and line graphs for tracking customer trends.
Step 6: Test the Dashboard (Day 9)
Before finalizing, thoroughly test the dashboard with a small group of users:
- Ensure the dashboard is delivering the insights needed.
- Test for usability and speed; it should load quickly and be easy to navigate.
- Make sure the data aligns with the KPIs and is accurate.
Fact: Testing is often overlooked but can prevent up to 50% of reporting errors down the line .
Step 7: Monitor and Update (Ongoing, starting Day 10)
The digital dashboard is not static. Regular monitoring and updates are necessary to ensure data accuracy and usefulness:
- Set a schedule to update data sources in real-time or periodically.
- Adjust the dashboard layout or metrics as business needs evolve.
Fact: According to industry data, companies that regularly update their dashboards see a 20-30% increase in productivity .
Examples Of Digital Dashboards (Best Practices)
A user tracking dashboard is an essential tool for businesses looking to monitor, analyze, and optimize user behavior across their platforms. Whether you run a website, mobile app, or SaaS product, tracking how users interact with your platform can provide critical insights into their preferences, usage patterns, and pain points.

Understanding the Different Types of Dashboards
| Dashboard Type | Purpose | Target Users | Data Type | Use Case |
|---|---|---|---|---|
| Strategic Dashboard | Provides a high-level overview of company performance and progress toward strategic goals. | Business owners, C-level executives, managers. | High-level metrics like revenue, churn rate, and company-wide KPIs. | Tracking revenue growth, goal achievement, and forecasting future performance. |
| Operational Dashboard | Tracks real-time activity in a specific business area, helping manage day-to-day operations. | Project managers, business managers, team leaders. | Real-time data on specific business activities like project management, invoicing, and sales tracking. | Managing project timelines, budgets, and immediate business outcomes. |
| Tactical Dashboard | Offers in-depth analysis of business processes to improve decision-making and detect patterns. | Subject matter experts, business analysts. | Larger volumes of historical data, analyzed to detect trends and improve processes. | Analyzing performance to identify opportunities for operational improvement. |
| Analytical Dashboard | Uses data visualization to analyze historical data for deeper business intelligence insights. | Data analysts, marketing teams, product teams. | Comprehensive data sets with multiple filters and views for deep analysis of performance metrics. | Understanding detailed performance metrics such as agent productivity, customer behavior, and marketing effectiveness. |
Bottom Line
Digital dashboards are vital tools in 2024, offering real-time insights for better decision-making. Whether for strategic oversight or detailed data analysis, they help businesses track key metrics and stay competitive. Mastering them is essential for navigating today’s data-driven landscape.
Let Go Digital elevate your business with high-quality marketing services. We provide optimized solutions, including comprehensive dashboards that allow you to easily track and understand your business performance. Contact us today to unlock your potential!


