For SaaS entrepreneurs, these two types of indicators serve as the essential tools needed to evaluate business health and make informed strategic decisions: leading and lagging indicators. Understanding the distinction between them two is crucial for sustained growth.
This article delves into leading and lagging indicators examples, showcasing how they can drive strategic decisions, optimize performance, and ensure that your SaaS company stays ahead in a competitive market.
Don’t overlook these vital metrics—they could make or break your business’s growth trajectory.
What Are Leading and Lagging Indicators?

Leading Indicators
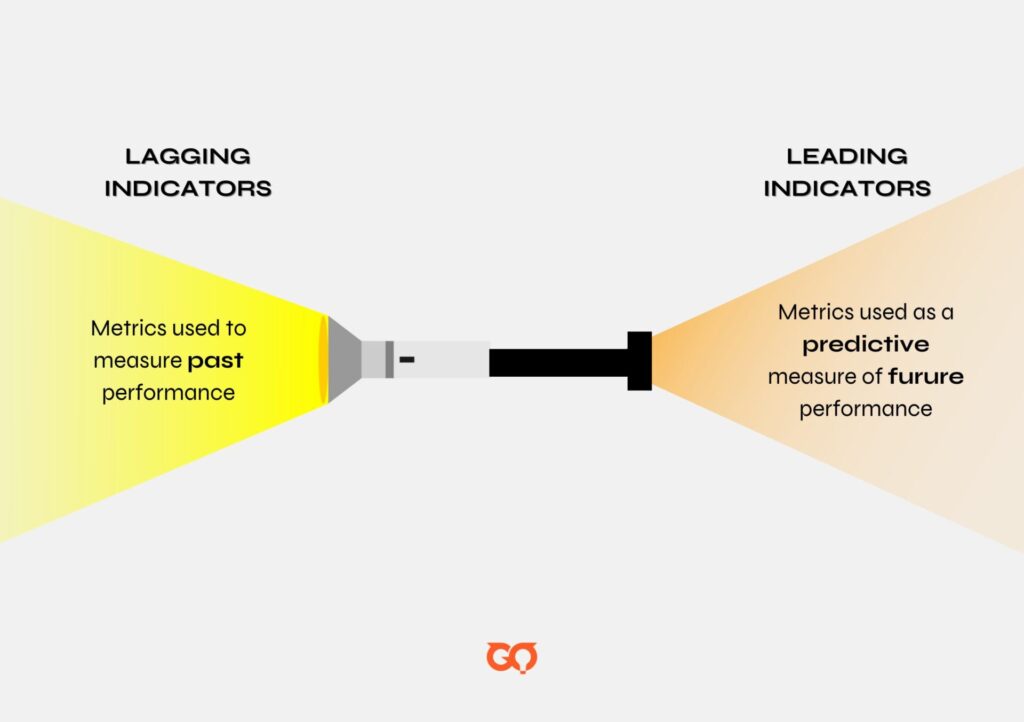
Leading indicators predict future changes, offering valuable insights into potential trends and outcomes before they occur.
A leading indicator is a type of data that can help forecast future economic trends. It gives an early signal of where the economy might be headed, allowing businesses, investors, and policymakers to prepare or adjust their strategies accordingly. This makes them valuable tools for planning and decision-making.
Lagging Indicators
Lagging indicators measure past performance and results, often referred to as “output” metrics.
These indicators help confirm trends that have already occurred, making them useful for assessing the effectiveness of business operations, strategies, and financial market trends.
Unlike leading indicators, lagging indicators show how things have turned out, offering valuable insights into what has happened. They are often used to validate trends in the economy, guide business decisions, and inform investment strategies.
Examples of Leading and Lagging Indicators
To help organizations connect their strategic goals with actionable measures, we will draft out some examples on leading and lagging indicators, focusing on four key areas: Financial, Customer, Internal Processes, and Learning & Growth.
Here’s how it works:
To drive growth, companies start by setting clear objectives in each of these four areas. Next, they identify lead measures—specific tasks and actions needed to reach those goals. Finally, they use lag measures to assess whether their strategies are working and if they’re on track to meet their objectives.
To assist you in this process, we’ve included practical examples that you can easily apply to your business.
| Strategic Objectives | Lead Measure | Lag Measure |
|---|---|---|
| Financial Perspective | ||
| Improve return on investment | Add three more products to the portfolio this year | Return on investment |
| Broaden revenue portfolio | Add three more products to the portfolio this year | Revenue growth |
| Reduce overall costs | Implement cost-saving initiatives | Expense costs |
| Customer Perspective | ||
| Increase customer satisfaction | More account management | Customer satisfaction score |
| Increase company awareness | Number of press articles | Number of inbound customer inquiries |
| Decrease customer attrition | Improved customer service | Retention rate |
| Internal Processes Perspective | ||
| Create innovative products | Product development cycle | New product/service revenue |
| Improve the knowledge base | Number of articles submitted | Knowledge base effectiveness |
| Reduce operational problems | Hours spent resolving customer issues | Product/service error rate |
| Learning and Growth Perspective | ||
| Development of strategic skills | Training hours per employee | Employee satisfaction |
| Better strategic communication | Availability of key information | Communication effectiveness |
| Alignment of personal goals | Goal alignment | Revenue per employee |
| 🎯 Case Study: Utilizing Leading and Lagging Indicators to Enhance Business Performance Overview: An enterprise SaaS company with an annual subscription model effectively uses leading and lagging indicators to monitor performance, anticipate challenges, and drive growth. This case study explores how the company leverages specific leading and lagging indicators examples to make informed strategic decisions and enhance business outcomes. Leading Indicator: Early Software Renewals Tracking early software renewals serves as a key leading indicator, signaling high customer satisfaction and potential long-term loyalty. When the company observed a trend of early renewals among a particular customer segment, it intensified customer service efforts and offered personalized incentives. This strategy not only boosted renewal rates but also strengthened customer loyalty, ensuring more stable revenue. Lagging Indicator: Renewal Rates Renewal rates are monitored as a crucial lagging indicator to evaluate the effectiveness of customer retention strategies. After identifying a decline in renewal rates, the company enhanced its customer support and expedited product updates. The subsequent improvement in renewal rates validated these changes, providing a clear measure of success. |
The Difference Between Leading and Lagging Indicators
Understanding the difference between leading and lagging indicators is key to effective performance management. Together, they provide a balanced approach, ensuring businesses can both anticipate changes and assess their progress toward goals.
| Aspects | Leading Indicators | Lagging Indicators |
|---|---|---|
| Purpose | To anticipate and influence future outcomes. | To confirm and understand what has already happened. |
| Measurement | Predictive and often harder to measure; requires identifying relevant actions. | Retrospective and easier to measure; involves quantifying results or outcomes. |
| Examples | Sales calls made, marketing campaigns launched, safety training provided. | Sales figures, accident logs, customer satisfaction scores. |
| Role in Business Strategy | Helps guide and adjust strategies to achieve future goals. | Provides feedback on the effectiveness of past strategies. |
| Decision Making | Influences proactive decision-making to shape future results. | Informs reactive decision-making based on past performance. |
| Challenges | Difficult to determine and validate; requires investment before results are seen. | Accurate and reliable but only useful for understanding past trends. |
| Importance | Critical for staying ahead and making adjustments to achieve strategic goals. | Essential for tracking progress and validating success. |
| Cause and Effect | Often a predictor of lagging indicators (e.g., employee satisfaction leading to customer satisfaction). | Reflects the results of lead indicators (e.g., customer satisfaction as a result of employee satisfaction). |
Benefits of Leading and Lagging Indicators

Leading Indicators
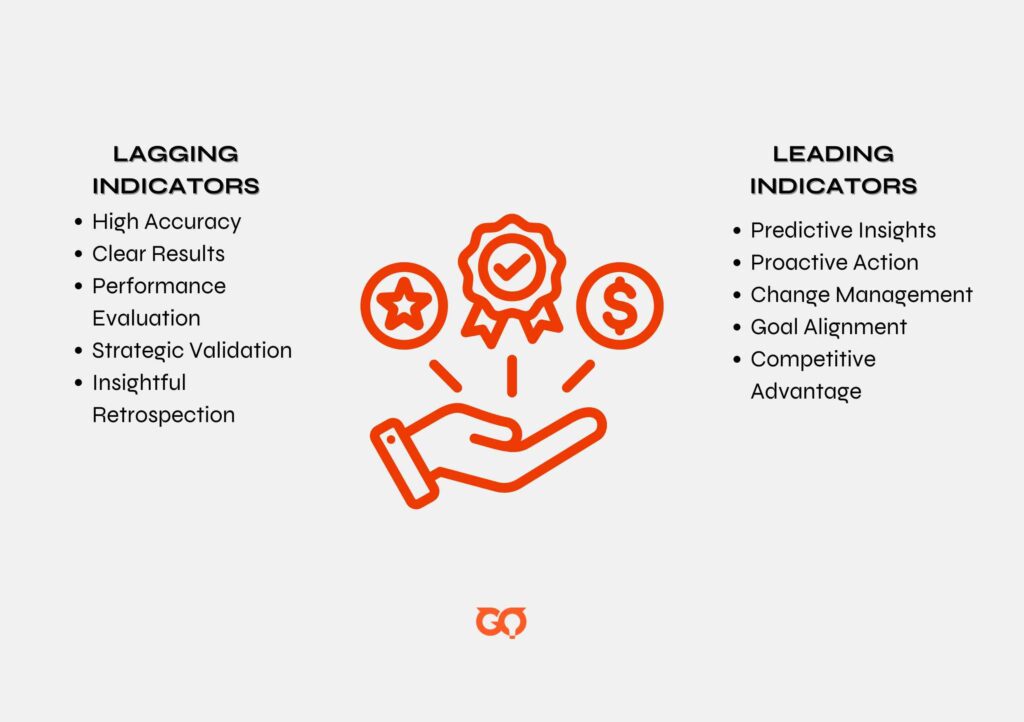
Leading indicators are predictive metrics that offer insights into future performance, allowing for early detection of potential problems. They are essential for change management, as they drive proactive actions that can improve future outcomes and increase the likelihood of meeting goals.
However, identifying the most relevant leading indicators can be difficult, and there is often uncertainty about their relationship with desired outcomes, leading to hesitation in decision-making. Additionally, efforts to improve these indicators can face resistance to change if the need for action isn’t clearly justified.
Lagging Indicators
Lagging indicators are highly accurate because they rely on hard data, providing clear, quantifiable measures of results that validate the effectiveness of strategies. They are crucial for understanding past performance, but they are inherently reactive, identifying issues only after they occur, making it difficult to take proactive action.
The complexity of lagging indicators can also make it challenging to pinpoint the exact causes of changes in performance. Moreover, they may create a false sense of control by focusing solely on past outcomes, which can overlook the underlying factors that drive those results.
How to Use Leading and Lagging Indicators To Measure Business Performance?

How to Use Leading Indicators
Leading indicators change more quickly and offer real-time coaching opportunities. They can be tracked continuously using a dashboard, allowing you to guide your team’s actions immediately.
Examples of leading indicators include customer meetings, satisfaction surveys, employee engagement surveys, and product usage metrics. These indicators are crucial for staying ahead of trends and making proactive decisions.
How to Use Lagging Indicators
Lagging indicators take longer to change but are invaluable for reviewing and strategizing. You can check these indicators less frequently, such as monthly or quarterly, and use them to inform your long-term strategy.
Examples of lagging indicators include financial metrics like revenue, profit margin, and cash flow. These metrics provide a clear view of how well your past strategies have performed.
Combining Leading and Lagging Indicators
When you combine leading and lagging indicators, you get the best of both worlds while minimizing their individual limitations.
Leading indicators provide insights into future trends and opportunities but can sometimes be inaccurate or too short-term focused. Lagging indicators offer a solid understanding of past performance but might cause you to miss opportunities or react too late to changes.
By using both, you can create a holistic view of performance and make more informed, balanced decisions. This combination ensures that your business stays on course with both immediate actions and long-term goals.
FAQs
Q1. Which type of indicators should you use to measure your business performance?
To effectively measure your business performance, you should use a combination of both leading and lagging indicators.
Key Performance Indicators (KPIs) are essential tools that provide quantifiable measurements to gauge a company’s long-term performance across strategic, financial, and operational aspects. While lagging indicators tell you what has already happened, offering insight into past achievements or failures, relying solely on them can limit your ability to make informed future decisions. This is where leading indicators come in; they are harder to measure but provide valuable insights that help predict future outcomes.
By combining both types of indicators, you can create a more complete and accurate picture of your business’s performance. Additionally, it’s important to consider coincident indicators for understanding your company’s current economic state in the context of the broader economy.
Ultimately, using lagging indicators without leading indicators only gives you half of the KPI picture, so it’s crucial to use them together to set your business on a path toward growth and success.
Q2. Which coincident indicators do you need to know?
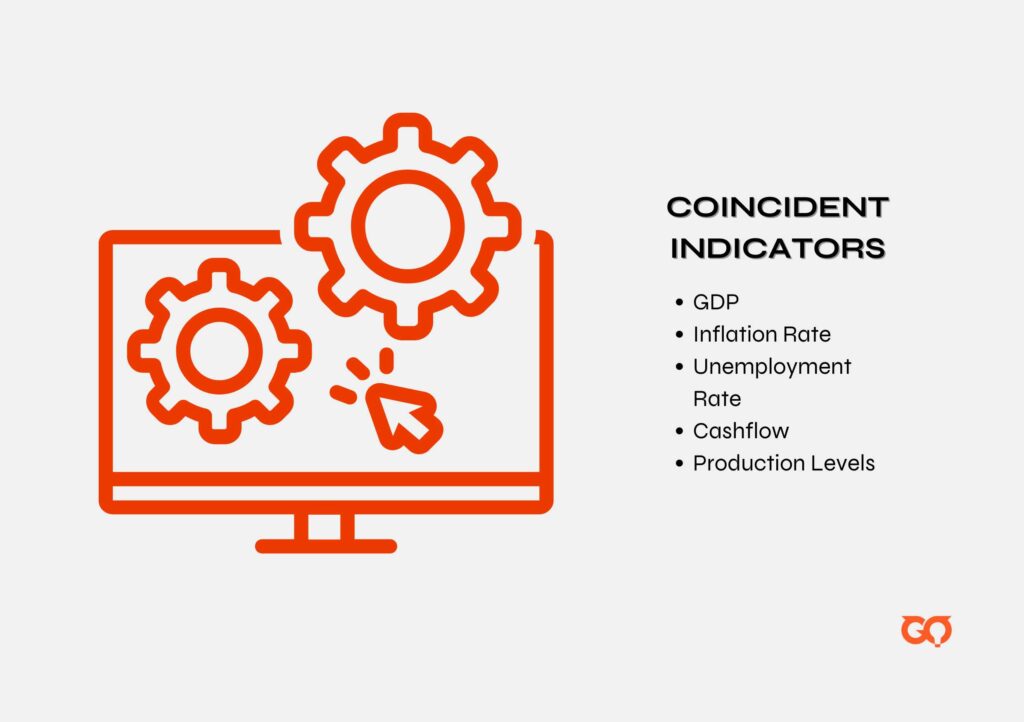
Coincident indicators reflect the present economic conditions and can help determine whether changes in your business are due to internal factors or broader trends. Key indicators to monitor include:
- Gross Domestic Product (GDP): Indicates overall economic health; a decline may explain a slowdown in your business.
- Inflation Rate: High inflation can increase costs and squeeze margins.
- Unemployment Rate: Low unemployment can make hiring difficult in a competitive market.
- Cashflow: Issues with receivables can lead to cash flow problems, even with strong revenue.
- Production Levels: Falling behind on demand or delivery may signal productivity issues.

Bottom Line
Understanding and using leading and lagging indicators is essential for SaaS companies to drive growth and make informed decisions.
This blog explores the key differences and provides practical leading and lagging indicators examples. It shows how these metrics can help monitor performance, anticipate challenges, and achieve strategic goals, ensuring your SaaS company stays competitive.
If you’re looking for a trusted partner to optimize your business, GO Digital is at your service! With years of expertise, we deliver detailed indicator reports and guarantee effective results. Reach out to us today!


